As with all crucial tools in Tidio, you can access detailed information on how Lyro performs. This can help you better understand how your visitors are using Lyro, and how you may improve your setup.
In this article, you will learn:
- How to access Lyro (and sales) analytics
- What metrics are available
- How to check Lyro's results at a glance in the Hub
- How to improve Lyro's performance
Accessing Lyro (and sales) analytics
Inside the Lyro AI Agent section of your Tidio panel, you will find the Analytics tab:
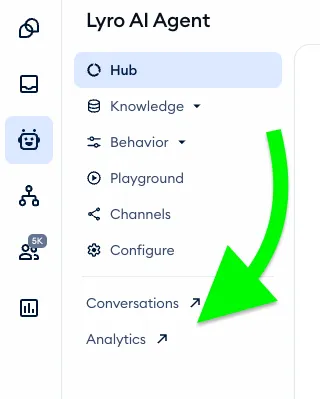
It's a kind of shortcut - clicking on it will effectively take you to the general Analytics section in Tidio, and to the AI support panel inside. You can access this manually as well, of course:
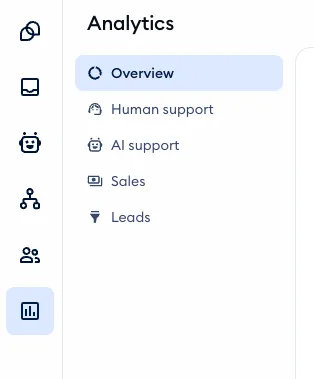
Note the Sales analytics section as well: that is a separate panel altogether, and includes valuable product-related details for both Shopify and non-Shopify store integrations. Please see this dedicated Analytics guide for more information about Sales analytics (and much more!).
The available metrics
The AI support panel grants you access to various Lyro-related metrics. Please note that these analytics are available on every plan, including Free - you can access them without the Growth package (as opposed to some other parts of the Analytics section)!
This panel is comprised of three separate tabs, each providing insights into the different ways your users interact with Lyro:

Live conversations
In this tab, you can see Lyro metrics associated with live conversations. At the top, you can select a timeframe that you'd like to analyze (using the calendar menu) and decide whether you'd like to check the metrics on a daily or monthly basis.
There are four general metrics available:
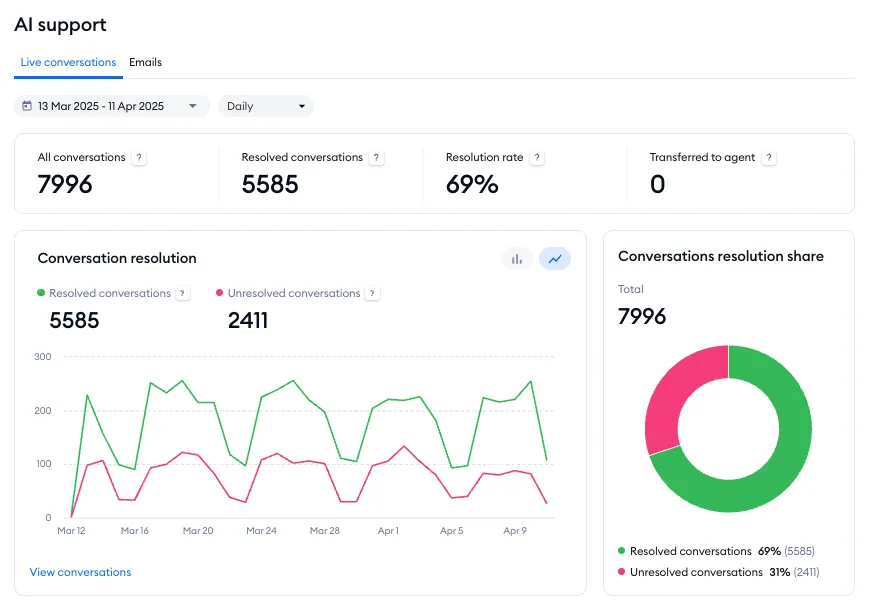
All conversations
The number of all live conversations that Lyro has handled (in the selected timeframe).
Resolved conversations
The number of all visitor questions that have been resolved by Lyro in general, without any agent's assistance (where the visitor either left the conversation or hasn't asked for a live agent's assistance).
Resolution rate
The percentage of all resolved conversations where Lyro provided an answer, without any agent's assistance.
Transferred to agent
The total number of conversations that Lyro transferred to your human agents.
Below the metrics listed above, you can see seven charts:
- Conversation resolution
- Conversations resolution share
- Resolution rate
- Asked questions
- Answer rate
- Answers by intent
- Satisfaction rate
Conversation resolution
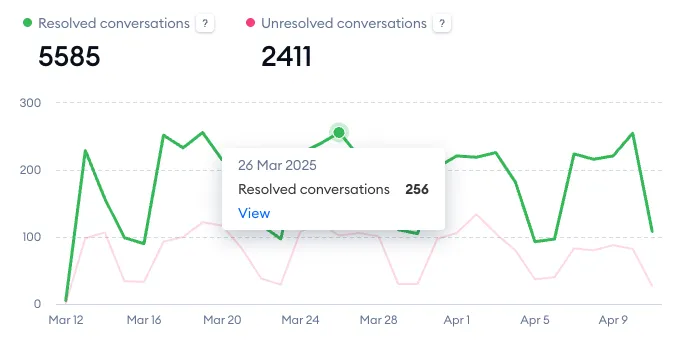
This chart shows two separate metrics: Resolved conversations (the total number of conversations where Lyro provided an answer, and the problem was solved) and Unresolved conversations (the total number of conversations where Lyro provided an answer, but the problem wasn't solved).
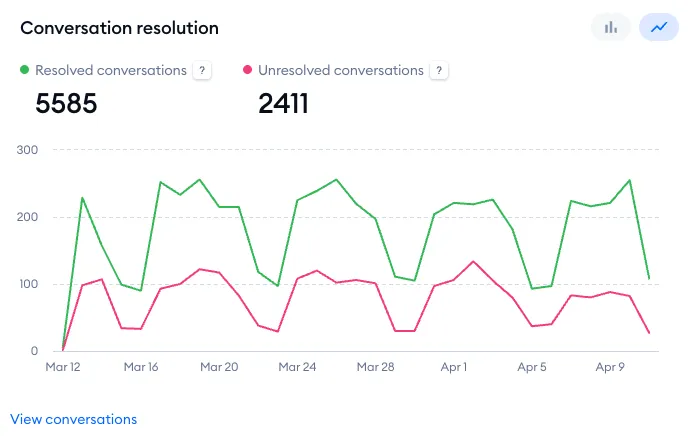
Hover your cursor over a specific point to see more details:
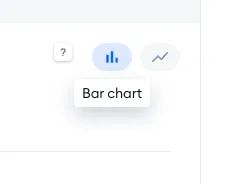
Note that you can switch between two modes here as well: line chart or bar chart:
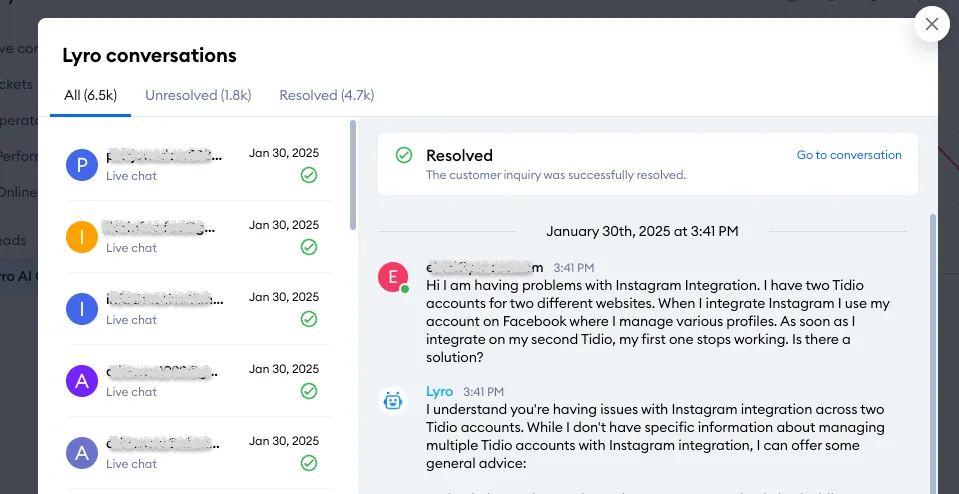
In the bottom-left of the chart, you can use the View conversations link and access all of Lyro's conversations from the selected timeframe. This allows you to see all of the chat transcripts, or just the resolved or unresolved ones:
Conversations resolution share
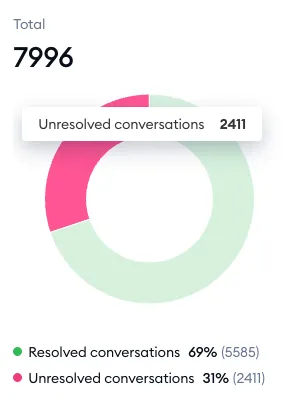
On the right, you can see the circular Conversations resolution share chart; it shows the total number of conversations handled by Lyro, as well as the percentage of Resolved and Unresolved conversations:
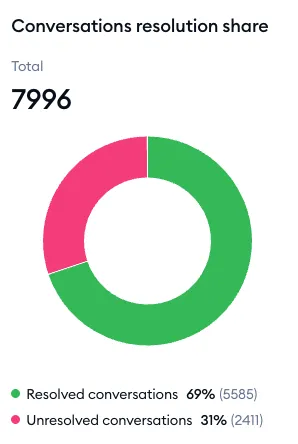
You can hove your cursor over one of the shares to see the exact number as well:
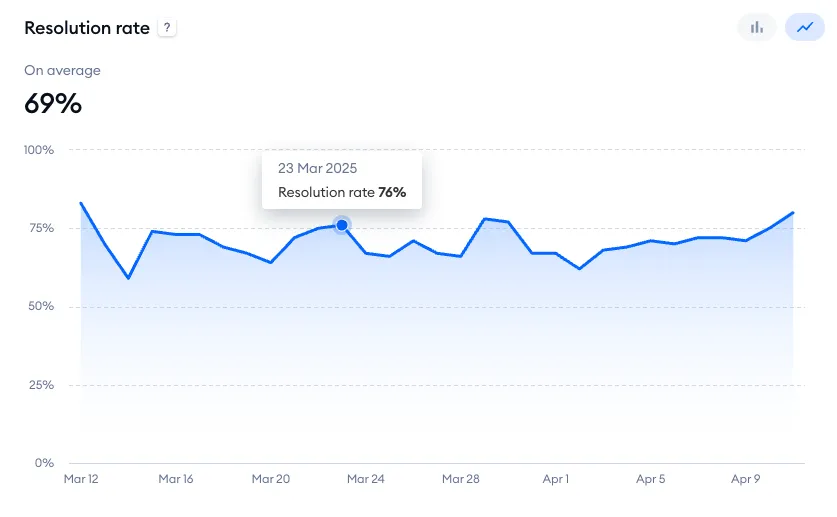
Resolution rate
This chart shows the percentage of conversations where Lyro provided an answer and the visitor either left or hasn't asked for live agent assistance. Hover your cursor over a specific point to see more details. You can switch between a line chart and bar chart mode here as well.
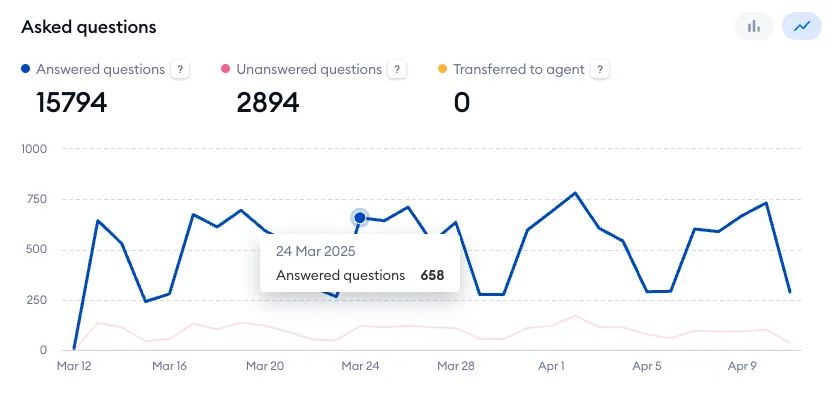
Asked questions
This chart shows three separate metrics: Answered questions (the total number of questions Lyro has been able to answer); Unanswered questions (how many questions Lyro hasn't been able to answer); and Transferred to agent (how many times a conversation has been transferred to a live agent for assistance). Hover your cursor over a specific point to see more details. You can switch between a line chart and bar chart mode here as well.
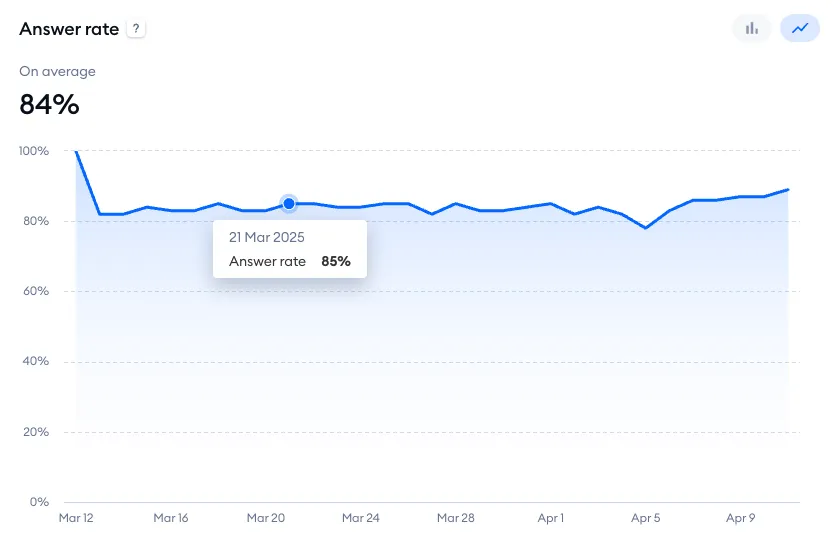
Answer rate
This chart shows the percentage of all visitor questions that have been answered by Lyro. Hover your cursor over a specific point to see more details. You can switch between a line chart and bar chart mode here as well.
Answers by intent
This list shows the most common topics that visitors ask about, as understood by Lyro AI. These intents are listed from the most common to the least common (you can use the Show more link at the bottom to see the complete list).
Each intent has several metrics displayed: the answer rate, the ratio of answered to unanswered, and the exact number of times the intent has been detected by Lyro. You can also access Lyro's Suggestions section by clicking on the Review suggestions link (with the number of suggestions) on the right of every intent - or you'll see No suggestions if there aren't any; this will let you see the entire list of individual questions that Lyro failed to answer successfully, for that particular intent.
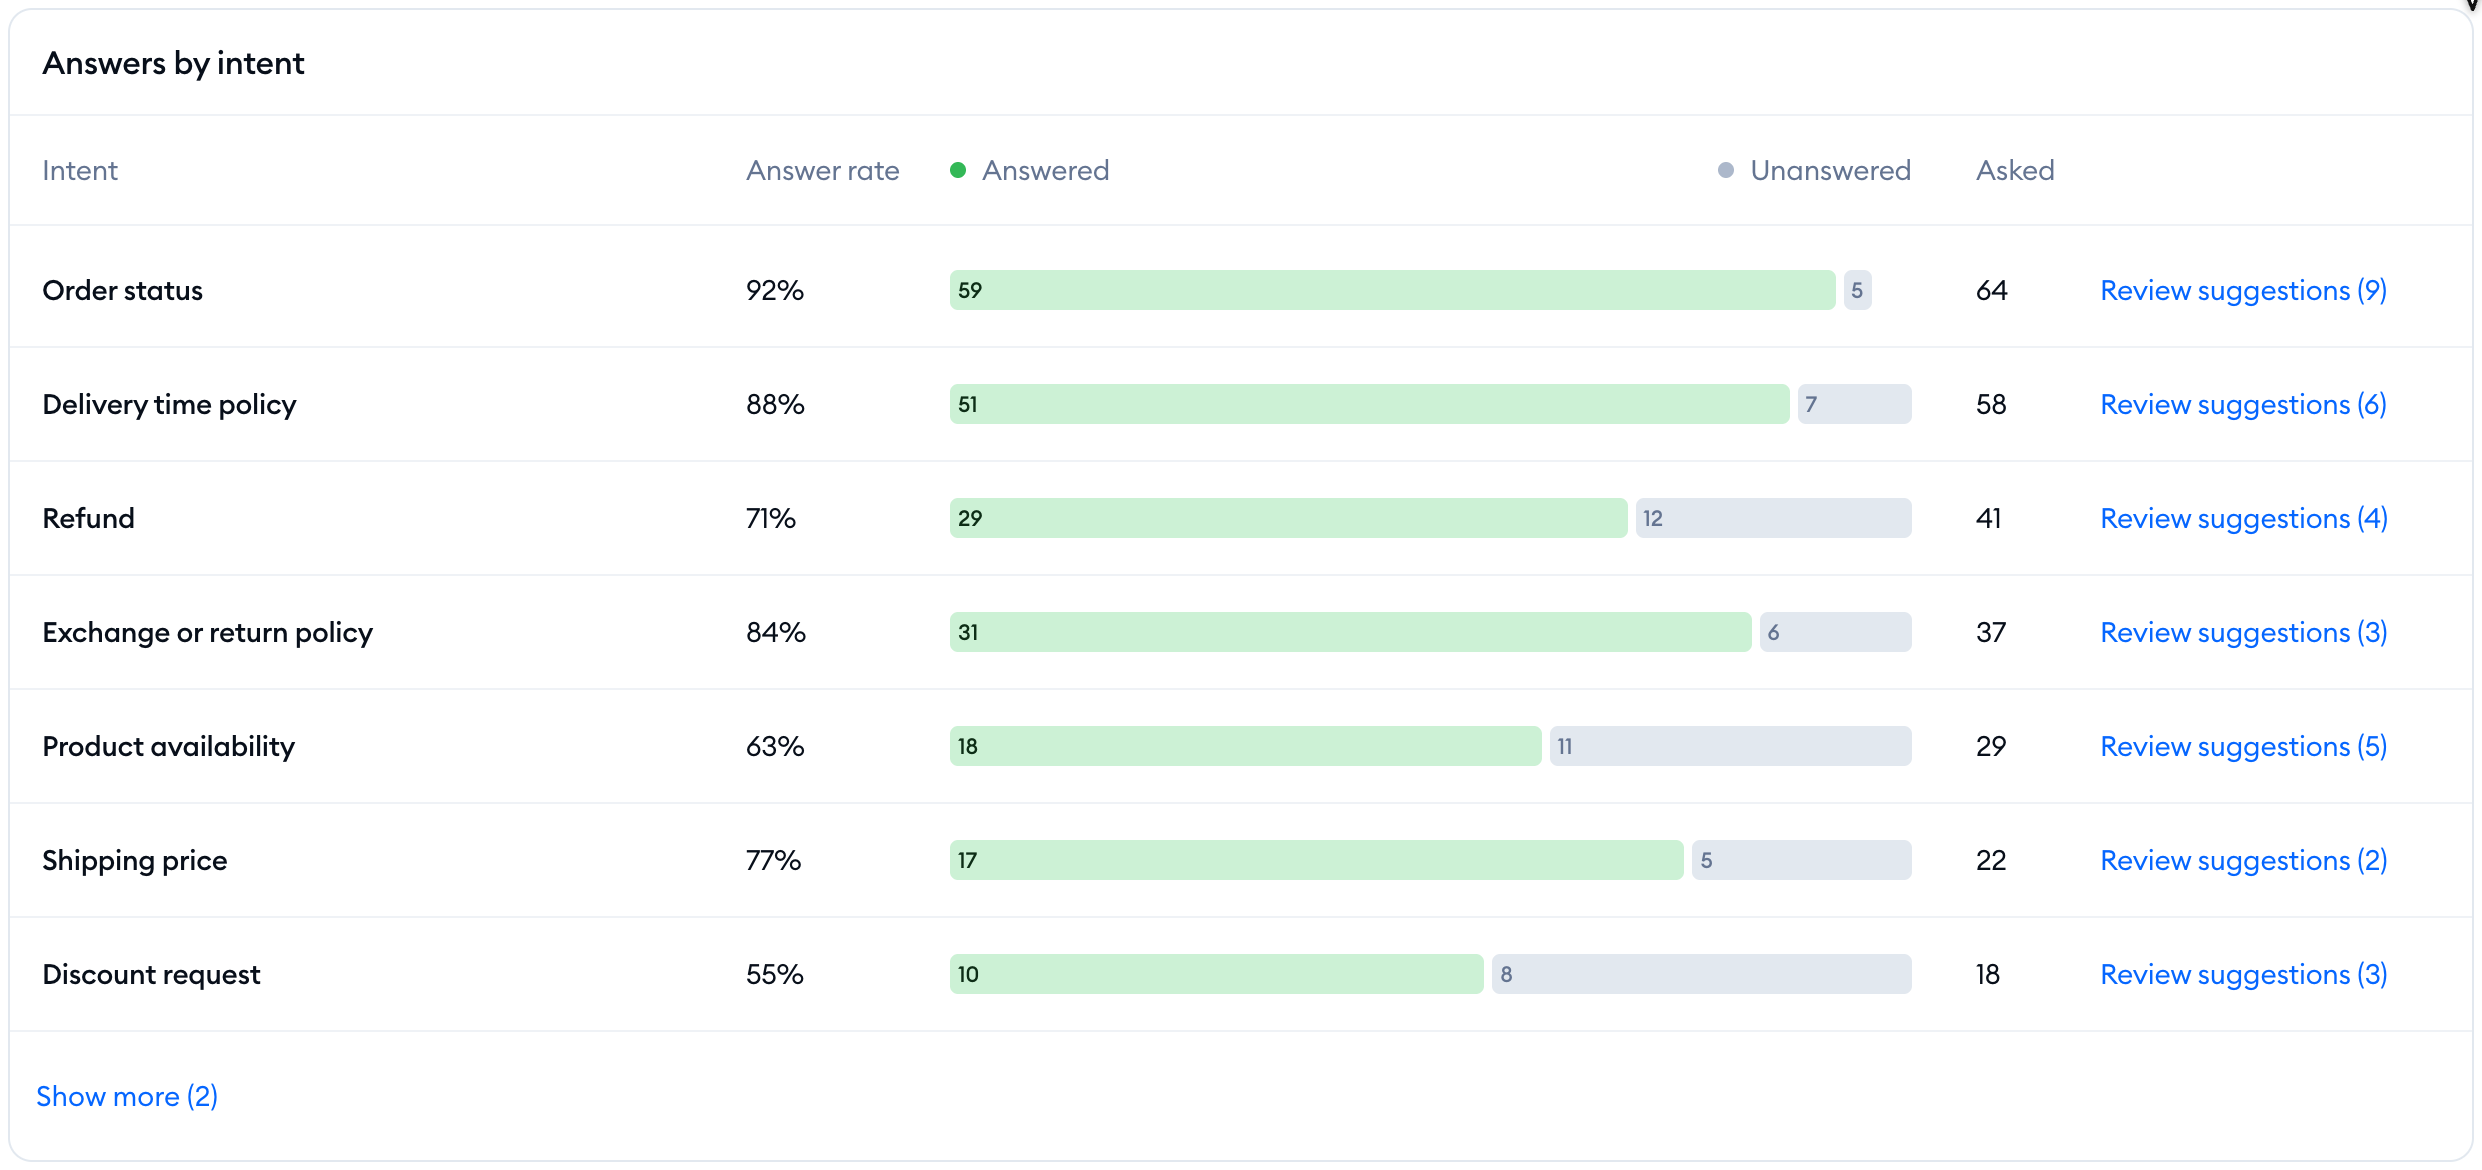
Please note: Answers by intent is shown for projects whose industry is an online store, an agency, beauty and wellness, or services (on other projects, it only appears once there's intent data to show). The list fills in once Lyro has detected at least 5 different intents in the selected timeframe.
Satisfaction rate
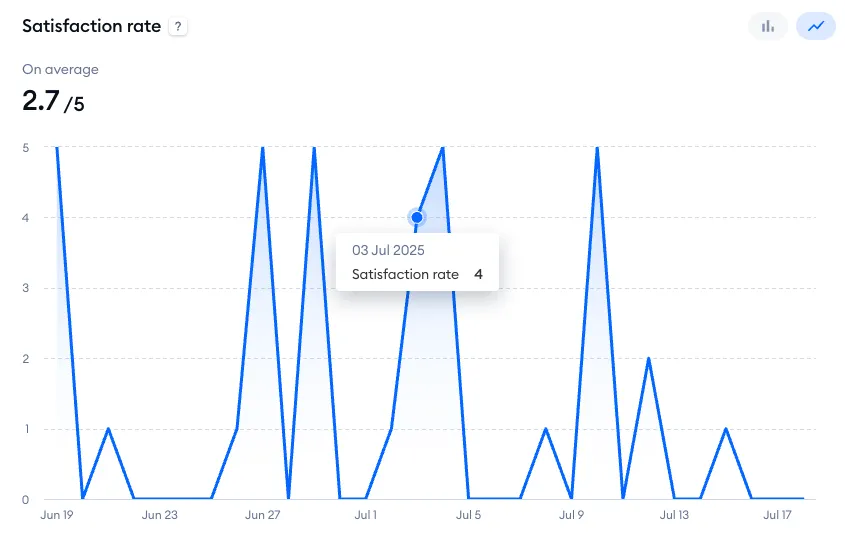
This chart represents Lyro's satisfaction score over time, calculated from the ratings left by visitors. Hover your cursor over a specific point to see more details. You can switch between a line chart and bar chart mode here as well.
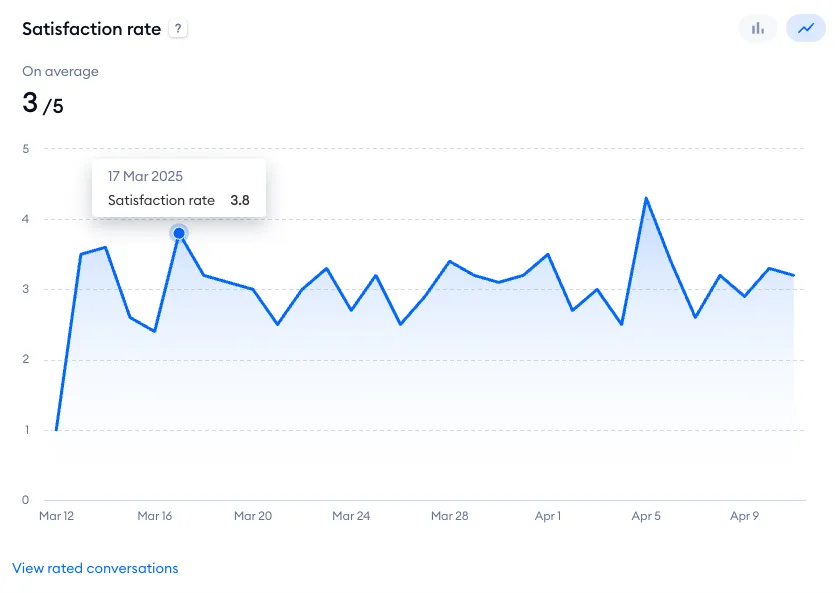
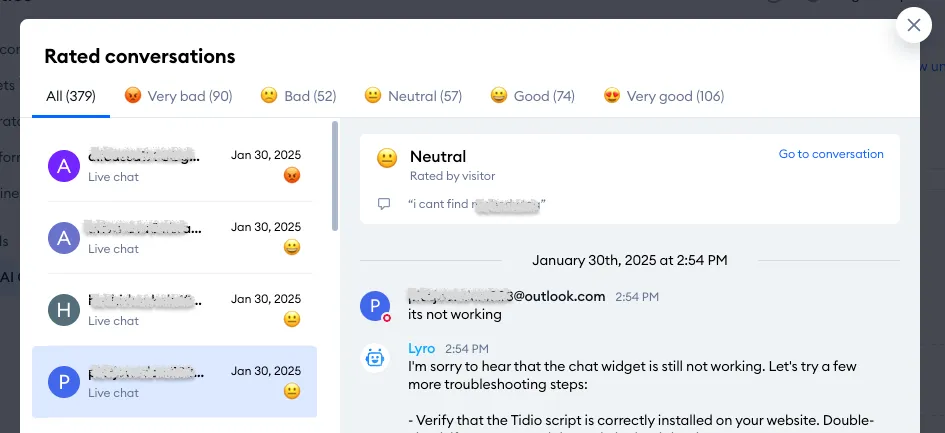
You can access a list of all rated Lyro conversations by clicking on the View rated conversations link at the bottom of the chart:
Emails
In this tab, you can see Lyro metrics associated with tickets (email threads). Starting October 26, 2026, Lyro answers your customers' follow-up emails too, not just the first email in a thread (see Lyro on email). The First-answer rate and Answers to first emails metrics are about the first email in each thread. At the top, you can select a timeframe that you'd like to analyze (using the calendar menu) and decide whether you'd like to check the metrics on a daily or monthly basis.
There are four general metrics available:
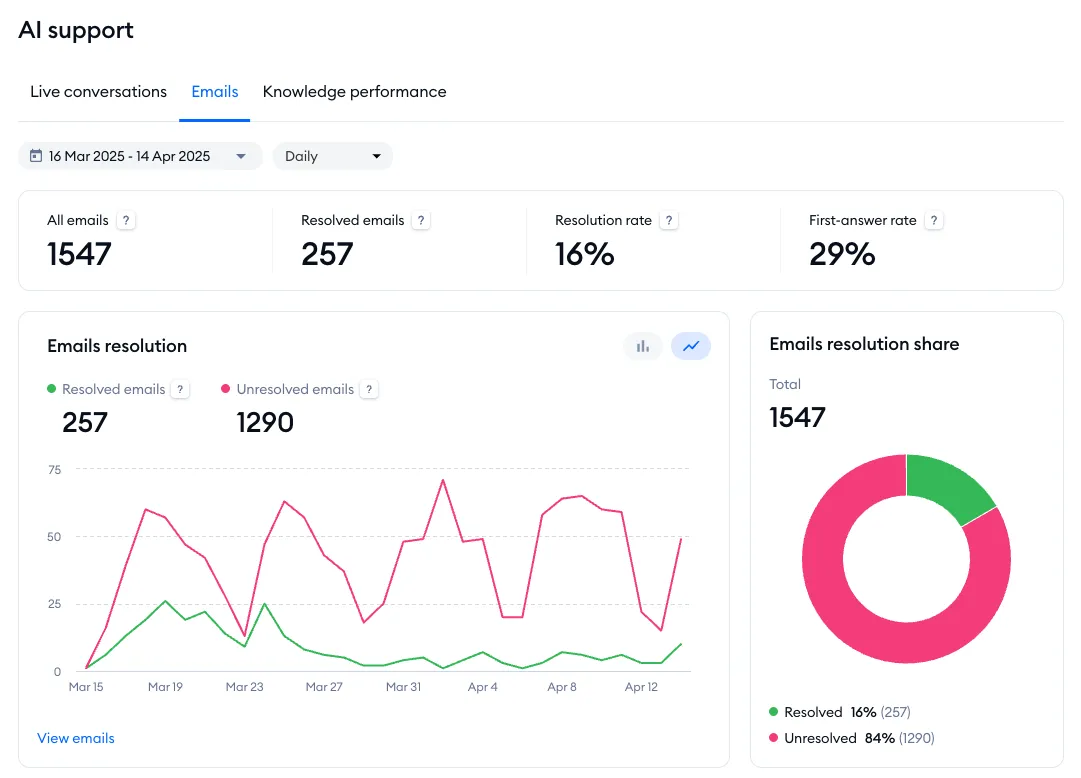
All emails
The number of all emails that Lyro has handled (in the selected timeframe).
Resolved emails
The number of all tickets that have been resolved by Lyro in general, without any agent's assistance.
Resolution rate
The percentage of all resolved tickets where Lyro provided an answer, without any agent's assistance.
First-answer rate
The percentage of first emails answered by Lyro.
Below the metrics listed above, you can see six charts:
- Emails resolution
- Emails resolution share
- Answers to first emails
- Resolution rate
- First-answer rate
- Satisfaction rate
Emails resolution
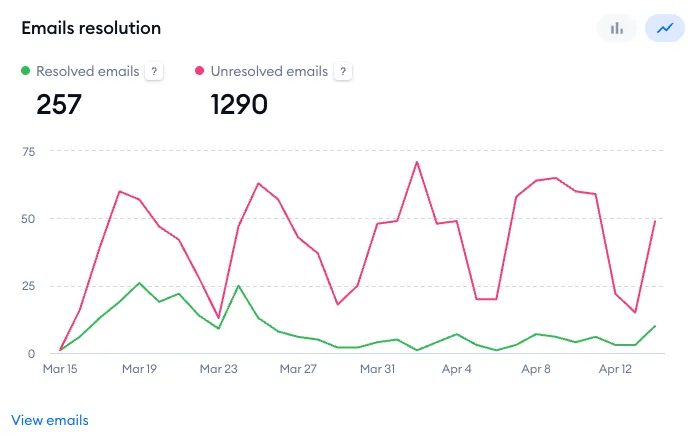
This chart shows two separate metrics: Resolved emails (the number of emails solved by Lyro without any agent assistance) and Unresolved emails (the number of emails not fully resolved by Lyro; the customer responded in the ticket and a live agent was needed). You can switch between a line chart and bar chart mode here as well. Please note the View emails link in the bottom-left as well; it allows you to see a list of all of the tickets that Lyro has handled.
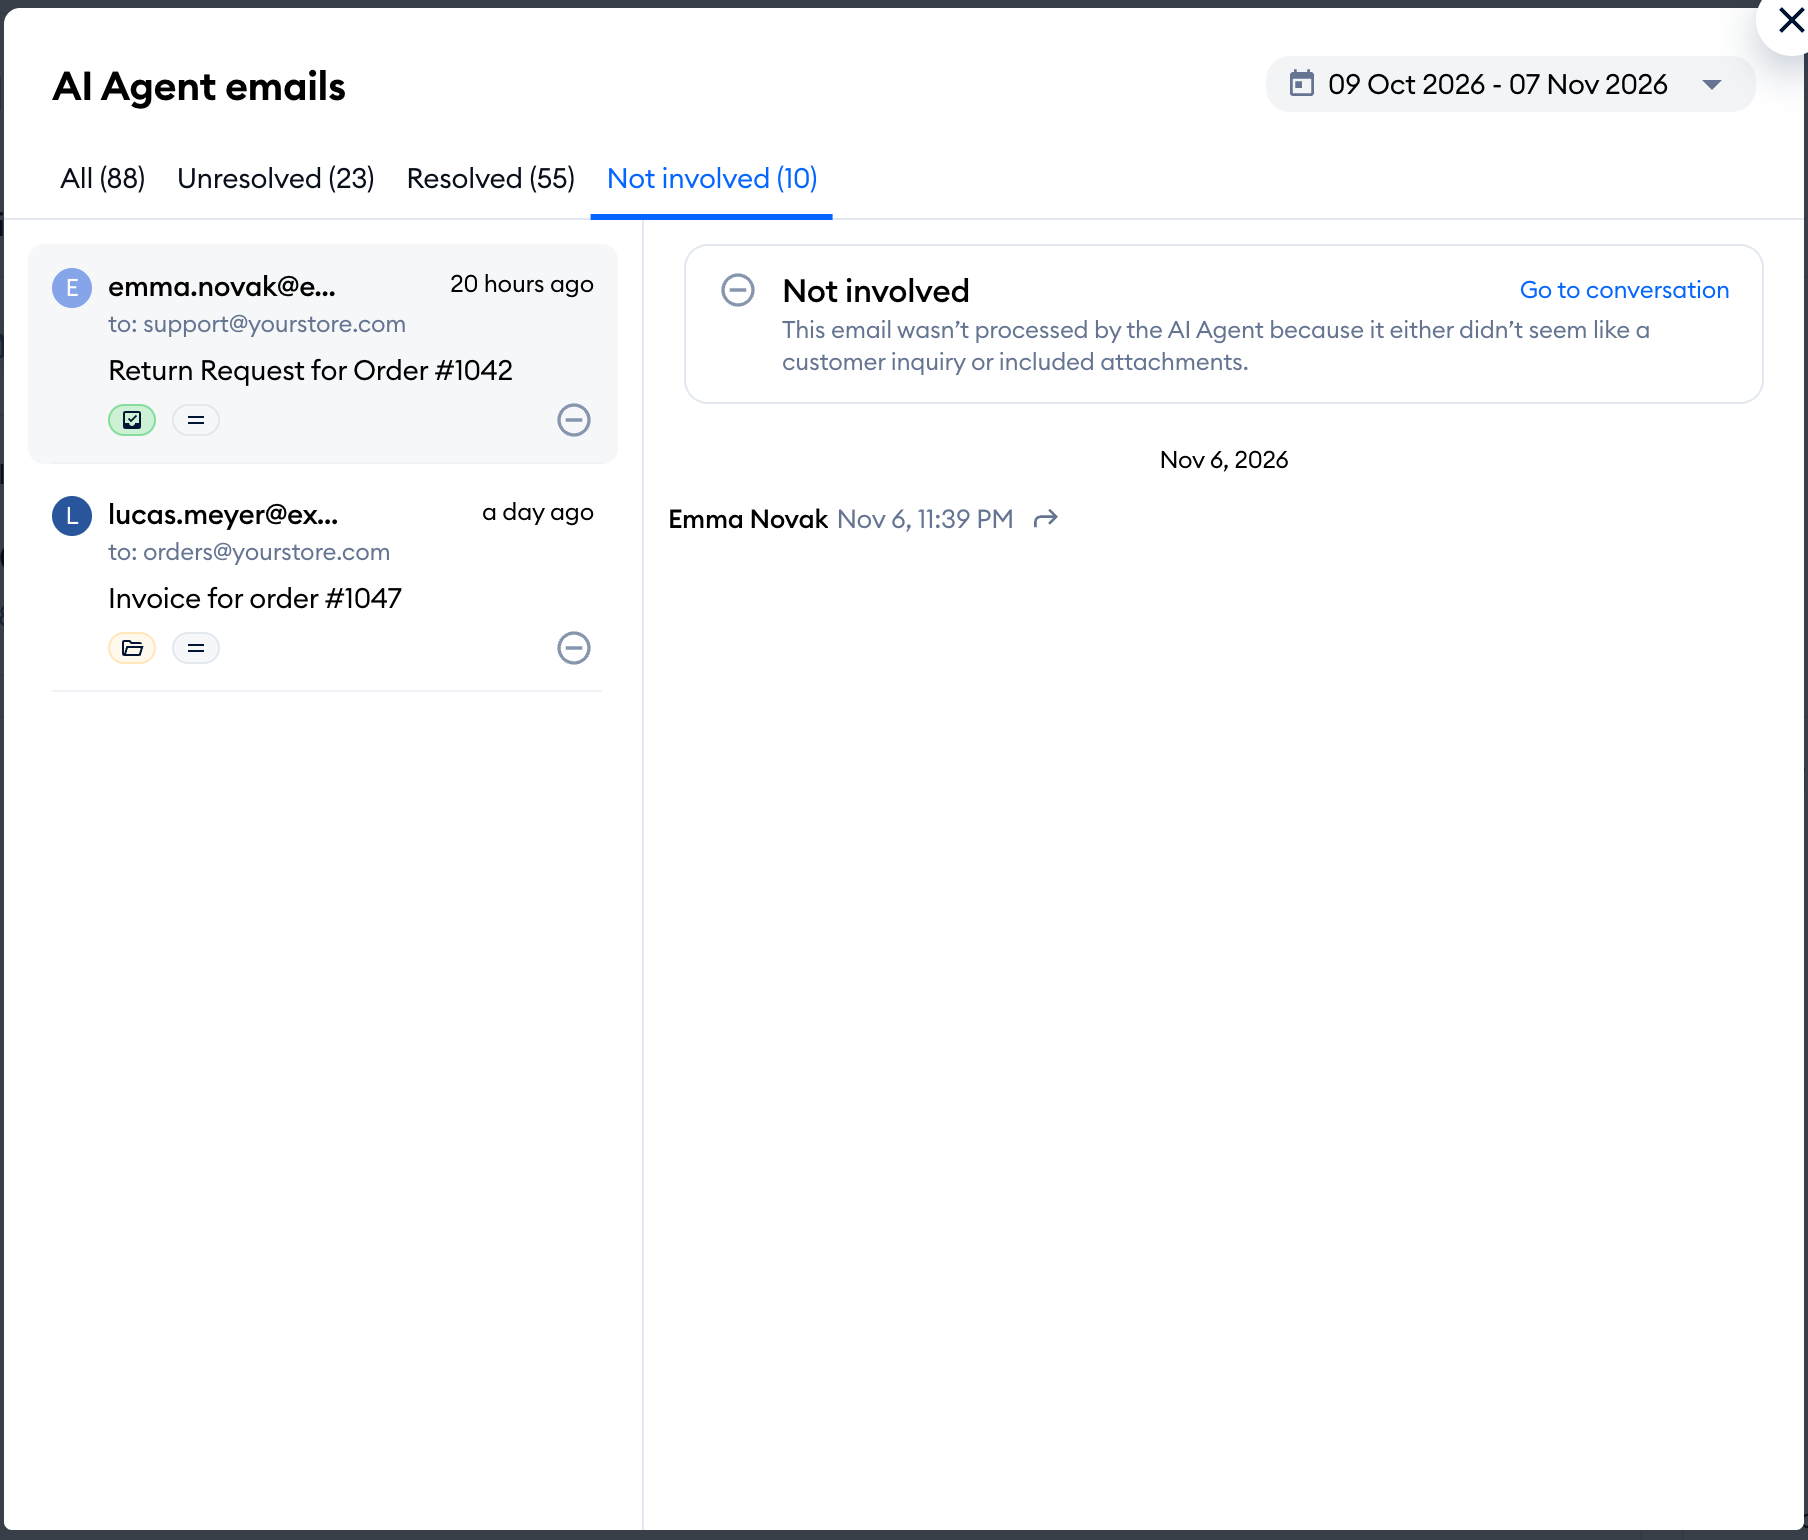
The list has four tabs: All, Unresolved, Resolved and Not involved. Not involved lists emails Lyro didn't process, because "it either didn't seem like a customer inquiry or included attachments". Click on an email to see its status and use Go to conversation to open the ticket:
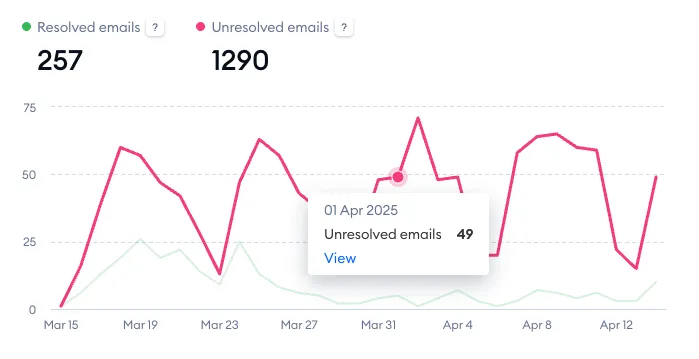
Hover your cursor over a specific point to see more details:
Emails resolution share
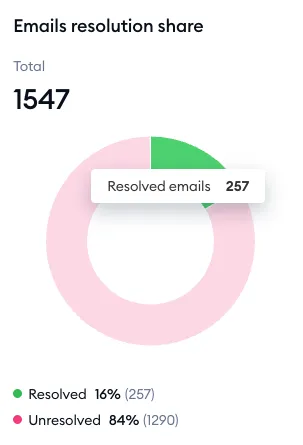
On the right, you can see the circular Emails resolution share chart; it shows the total number of tickets handled by Lyro, as well as the percentage of Resolved and Unresolved emails:
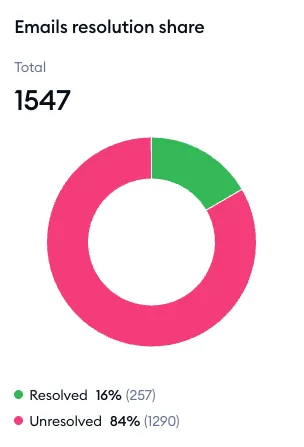
You can hove your cursor over one of the shares to see the exact number as well:
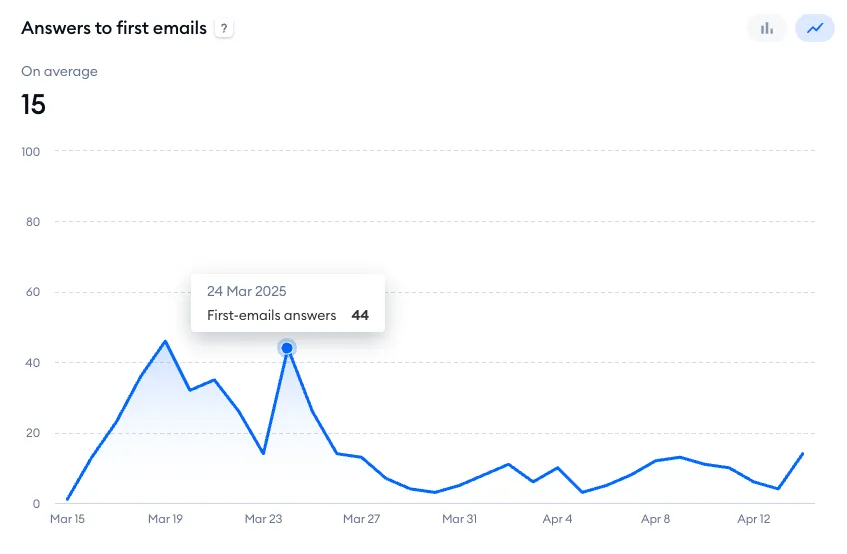
Answers to first emails
This chart shows the number of initial emails that have been answered by Lyro. This lets you see how well Lyro replies to the very first email in a thread. Hover your cursor over a specific point to see more details. You can switch between a line chart and bar chart mode here as well.
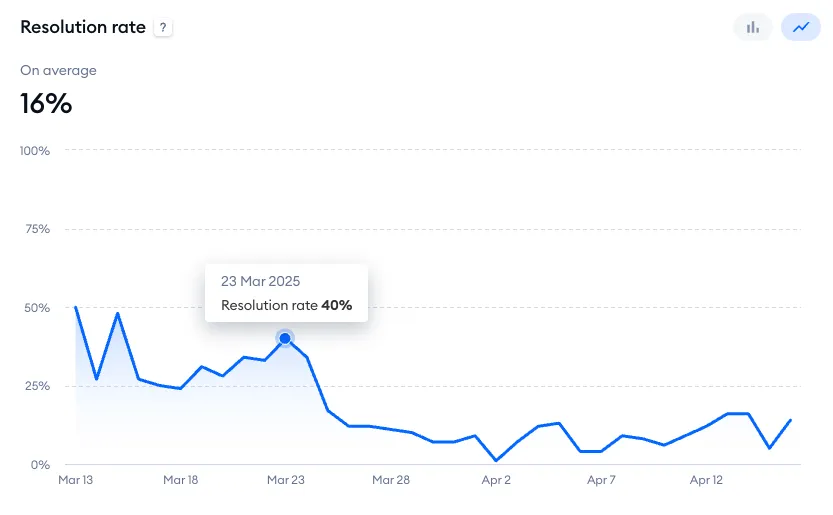
Resolution rate
This chart shows the percentage of tickets that Lyro has resolved without any agent assistance. Hover your cursor over a specific point to see more details. You can switch between a line chart and bar chart mode here as well.
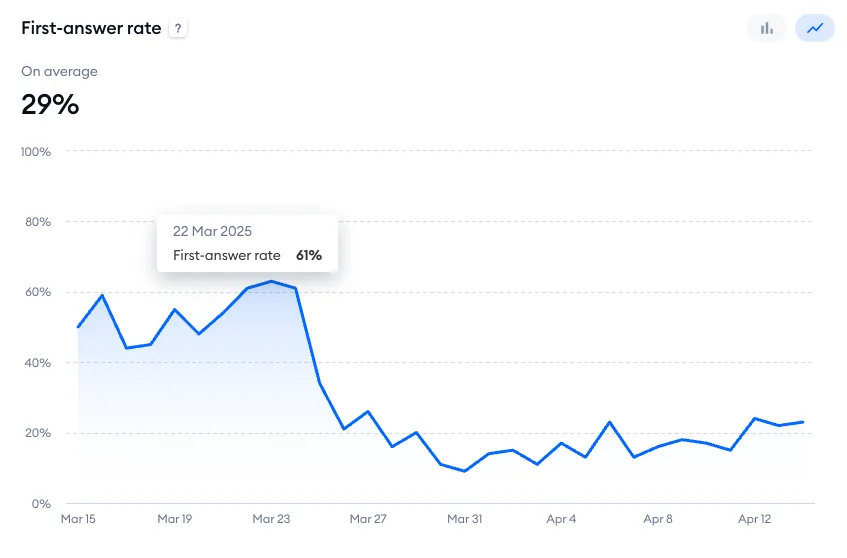
First-answer rate
This chart displays the percentage of Lyro's first-email replies. Hover your cursor over a specific point to see more details. You can switch between a line chart and bar chart mode here as well.
Satisfaction rate
An average of the ratings Lyro has gathered (for email responses) as well as specific scores for each day. Hover your cursor over a specific point to see more details. You can switch between a line chart and bar chart mode here as well.
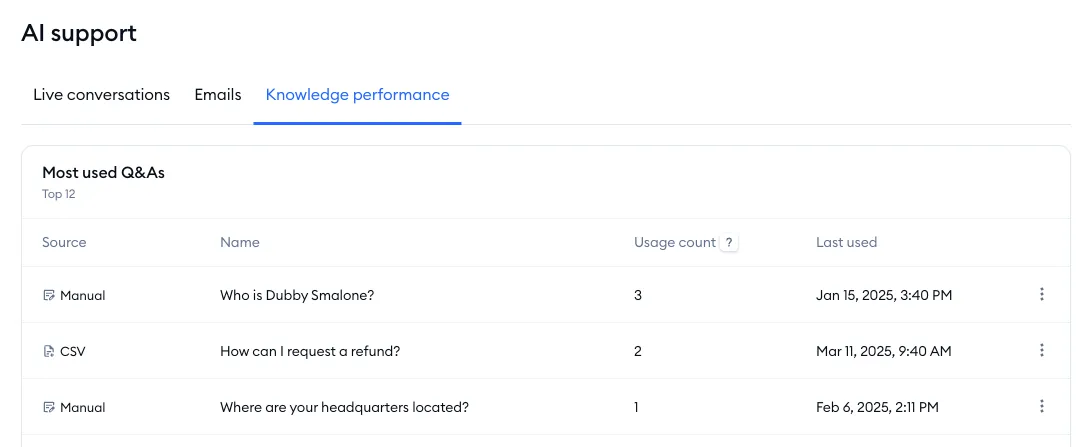
Knowledge performance
In the Knowledge performance tab, you can find a list of the most often used question-and-answer pairs.
The list shows a maximum of 200 Q&As, sorted by popularity. It includes the Q&A source, the question itself, the total usage count, and the date of its most recent usage.
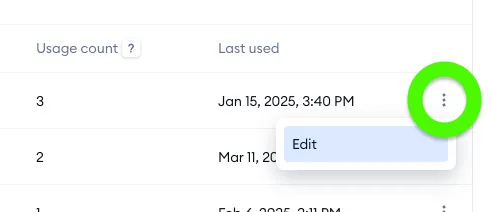
In addition to that, you can click on the three dots on the right, and use the Edit option:
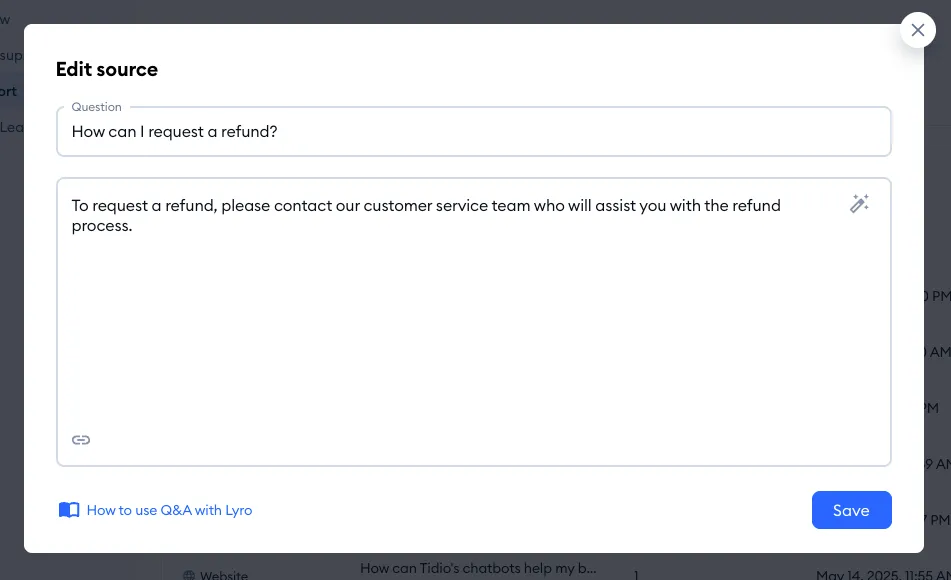
This way, you can actually view and modify the Q&A if necessary:
Checking Lyro's results at a glance in the Hub
For a quick look, head over to Lyro AI Agent > Hub. The Performance section there shows Lyro's results for the last 30 days, in two tabs - Live conversations and Emails:

- Involved - the percentage of new conversations (or emails) that Lyro handled.
- Resolution rate - the percentage of conversations Lyro resolved, out of all the conversations where it provided an answer.
- CSAT - the average satisfaction score from customers who rated their conversation with Lyro.
- Sales assisted (for Shopify stores) - revenue from orders influenced by Lyro's product recommendations. On other stores, you'll see Product card clicks instead: the number of clicks on the product cards Lyro recommended. This card appears on the Live conversations tab, once you've set up Products in Lyro AI Agent > Knowledge - until then, it offers a Set up Products link.
Hover over a card to see how it's calculated, and click on View full analytics to open the AI support report described above.
Improving Lyro's performance
Please note that you can access a summary of several key Lyro metrics in your Lyro Hub section; it serves as a general command center, with useful insights and links to relevant areas:
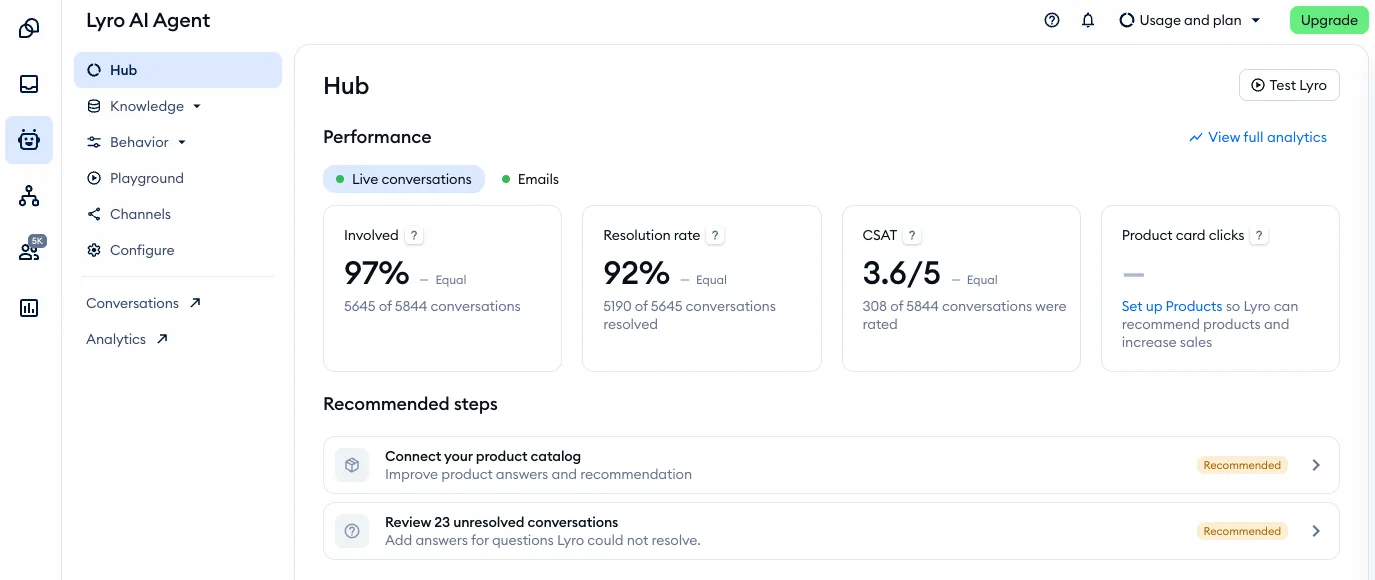
Among other things, you can see Lyro's overall performance (separately for live conversations and emails), as well as information about unanswered questions, helping you improve Lyro overall.
If you'd like to learn more about ways to improve Lyro's performance, please see this article for a comprehensive guide!
Further reading
- The Analytics section
- Lyro on email: answering whole email threads
- Data sources - Lyro's knowledge base
- Lyro Suggestions
- Lyro - the conversational AI agent