The Analytics section of your Tidio project allows you to access valuable details about your live conversations, tickets, agent performance, leads, sales, and the Lyro AI agent. See how your business can benefit from understanding the available metrics!
In this article, you'll learn:
- How to navigate the Analytics section
- The benefits of Analytics
- What the Overview panel can tell you
- What the human support metrics are
- What the AI support (Lyro) metrics are
- What the lead metrics are
- What the sales metrics are (Shopify)
- What the sales metrics are (non-Shopify)
Navigating your Analytics section
You can access your project's Analytics section from the main menu on the left:
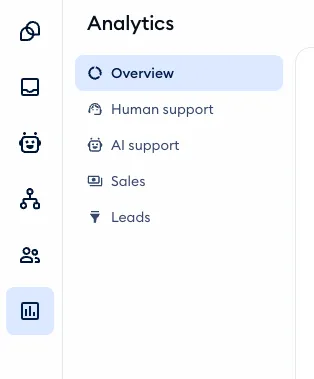
The Analytics section is divided into five main subsections, each allowing you to check different metrics of your project:
Please note: Overview, AI support and Leads are available on every plan, including Free. Human support and Sales are part of advanced analytics, available on the Growth plan and above - on a lower plan, clicking on them opens an upgrade window instead. The subsections you see also depend on your role's analytics permissions.
Analytics shows the Last 30 days by default (except Online hours, which shows one day at a time). Use the calendar menu to pick Today, Yesterday, Last week, This month, Last 90 days or your own dates.
Overview
In this panel, you get a general overview of your current data in chart form: Interactions, Lyro AI Agent resolution rate, Sales assisted, and Leads acquired. Each chart is comprised of several different metrics, giving you general insight into the different ways your visitors interact with Tidio, how Lyro AI is performing, and how you generate your leads.
For more details, see the dedicated section of this article.
Human support
This panel includes several different tabs, each containing information on different aspects of your human support: Live conversations, Tickets, Agents performance, and Online hours.
For more details, see the dedicated section of this article.
AI support
In this panel, you can see all the available metrics associated with Lyro, the AI agent. This includes separate metrics for live conversations and emails, as well as general knowledge performance.
For more details, see the dedicated section of this article.
Sales
The metrics in this panel can tell you about your Tidio-assisted sales and how your agents perform in this regard, as well as details on product-related conversations. The Sales panel is different depending on whether your Tidio project is integrated with a Shopify store or not.
For more details, see this section of the article for Shopify integrations, or this section for non-Shopify projects.
Leads
Here, you can see some details about how you've been acquiring your leads.
For more details, see the dedicated section of this article.
The benefits of Analytics
The goal of the analytics section is to help you assess your business' work on handling communication with your customers. By looking into the Analytics section, you'll learn about the following:
- The number of conversations and their trends
- The busiest hours
- How long your clients wait for your agents' responses
- The satisfaction ratings left by your customers
- Your agents' performance
- Revenue generated with the help of Tidio
- Ticketing performance
... and more!
Improve and organize your work by knowing how your agents perform, how to schedule their shifts, and understand the patterns behind the conversations rated positively or negatively.
Overview
This first panel gives you access to four different charts:
Note that you can always select the timeframe you'd like to analyze by selecting a range of dates from the calendar menu in the top-left:
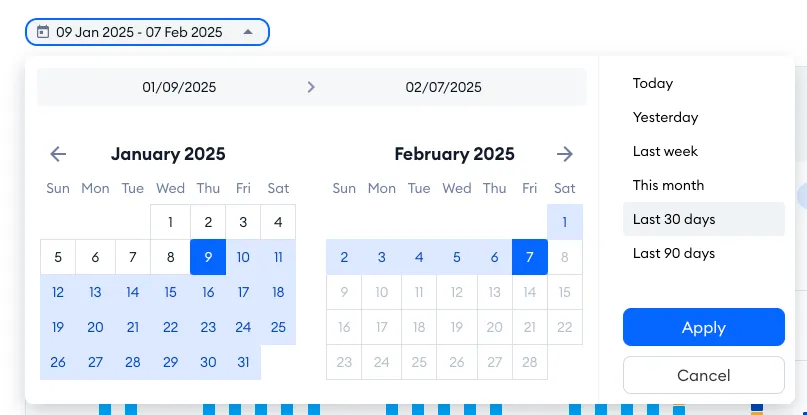
Please note that the Overview analytics only go a maximum of 90 days back (the other detailed subsections, like Human support or AI support, do not have this limitation).
If you're the owner or an admin of a project whose plan includes the Analytics API, you'll also see a box at the top of the Overview, titled Your Tidio data, now in your BI tool or AI assistant, with links to the API's documentation. You can close it with the cross icon.
Another useful feature is the option to choose between two different chart modes: the bar chart and the line chart. Depending on the chart and the data you're looking at, you might prefer one of these modes over the other. You can decide about that in the upper-right of some charts in Analytics:
Interactions
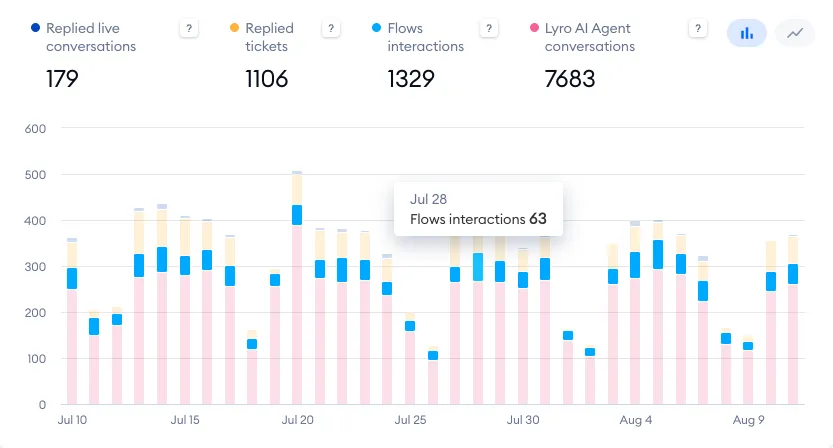
This tab shows you the overall number of interactions you've had in the selected time period, as well as four different metrics in the chart below:
- Replied live conversations
- Replied tickets
- Flows interactions
- Lyro AI agent conversations
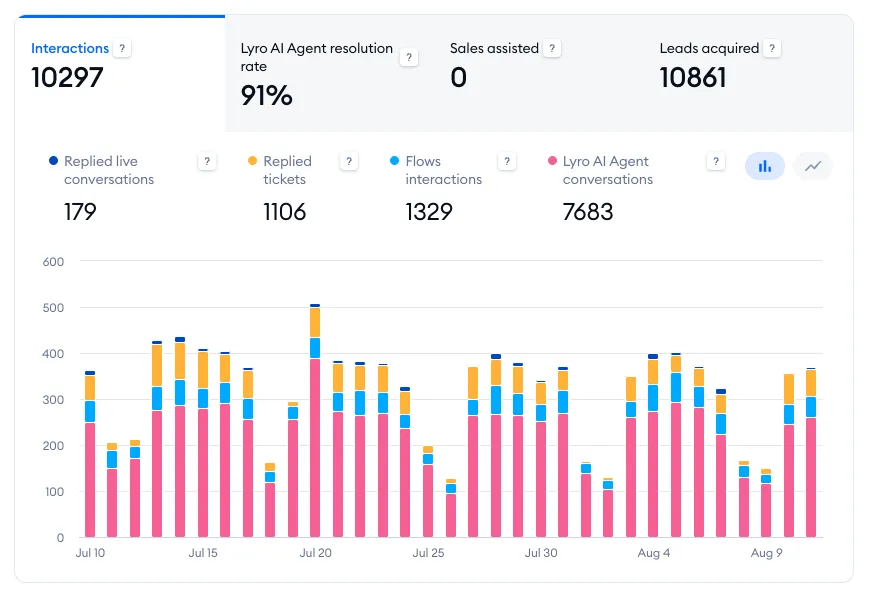
To see more details, hover your cursor over a specific bar (or point) on the chart:
Lyro AI Agent resolution rate
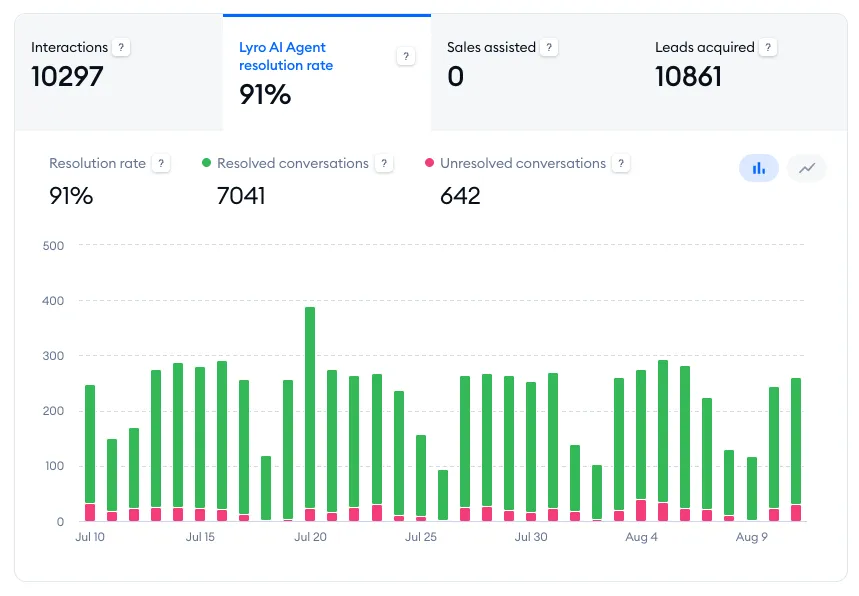
This tab shows you the overall percentage of conversations solved by Lyro (in the selected time period), as well as three different metrics in the chart below:
- Resolution rate
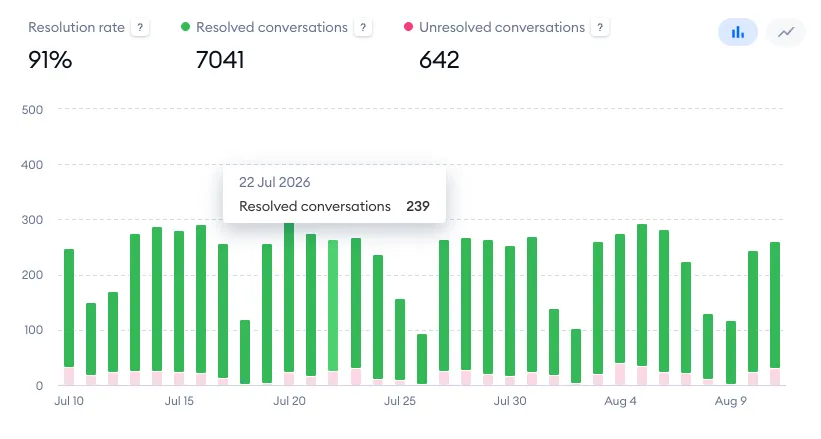
- Resolved conversations
- Unresolved conversations
To see more details, hover your cursor over a specific bar (or point) on the chart:
Sales assisted
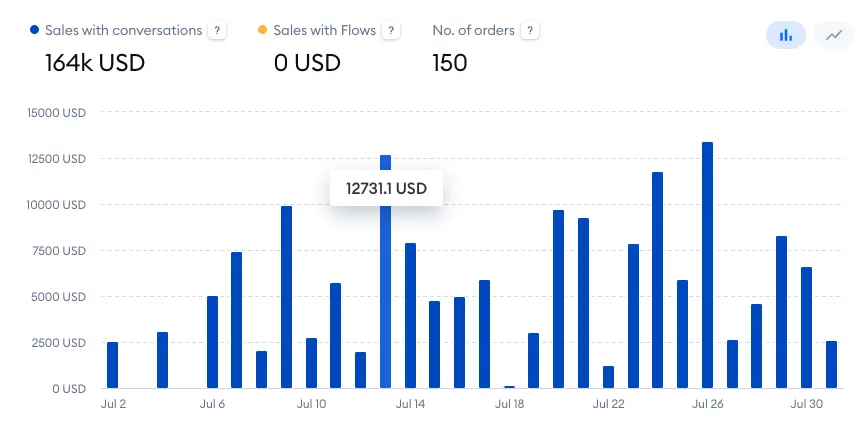
This tab shows you the sales revenue from all orders assisted by Tidio - by Lyro, Flows and your agents. The chart below splits it into three metrics, and shows the number of orders as well:
- Sales with Lyro - paid orders where the shopper clicked on one of Lyro's product recommendations before buying
- Sales with Flows - paid orders after the shopper interacted with a product recommendation or a coupon in a Flow
- Sales with agents - paid orders placed within 7 days after the shopper chatted with one of your agents
- No. of orders - the number of orders assisted by Tidio
The Sales assisted tab is there for every project, whichever platform your store is on - not only for Shopify stores. If you haven't made any assisted sales yet and you don't have a sales Flow, the Dashboard shows Increase your sales with Flows here instead, with the Add sales Flow button.
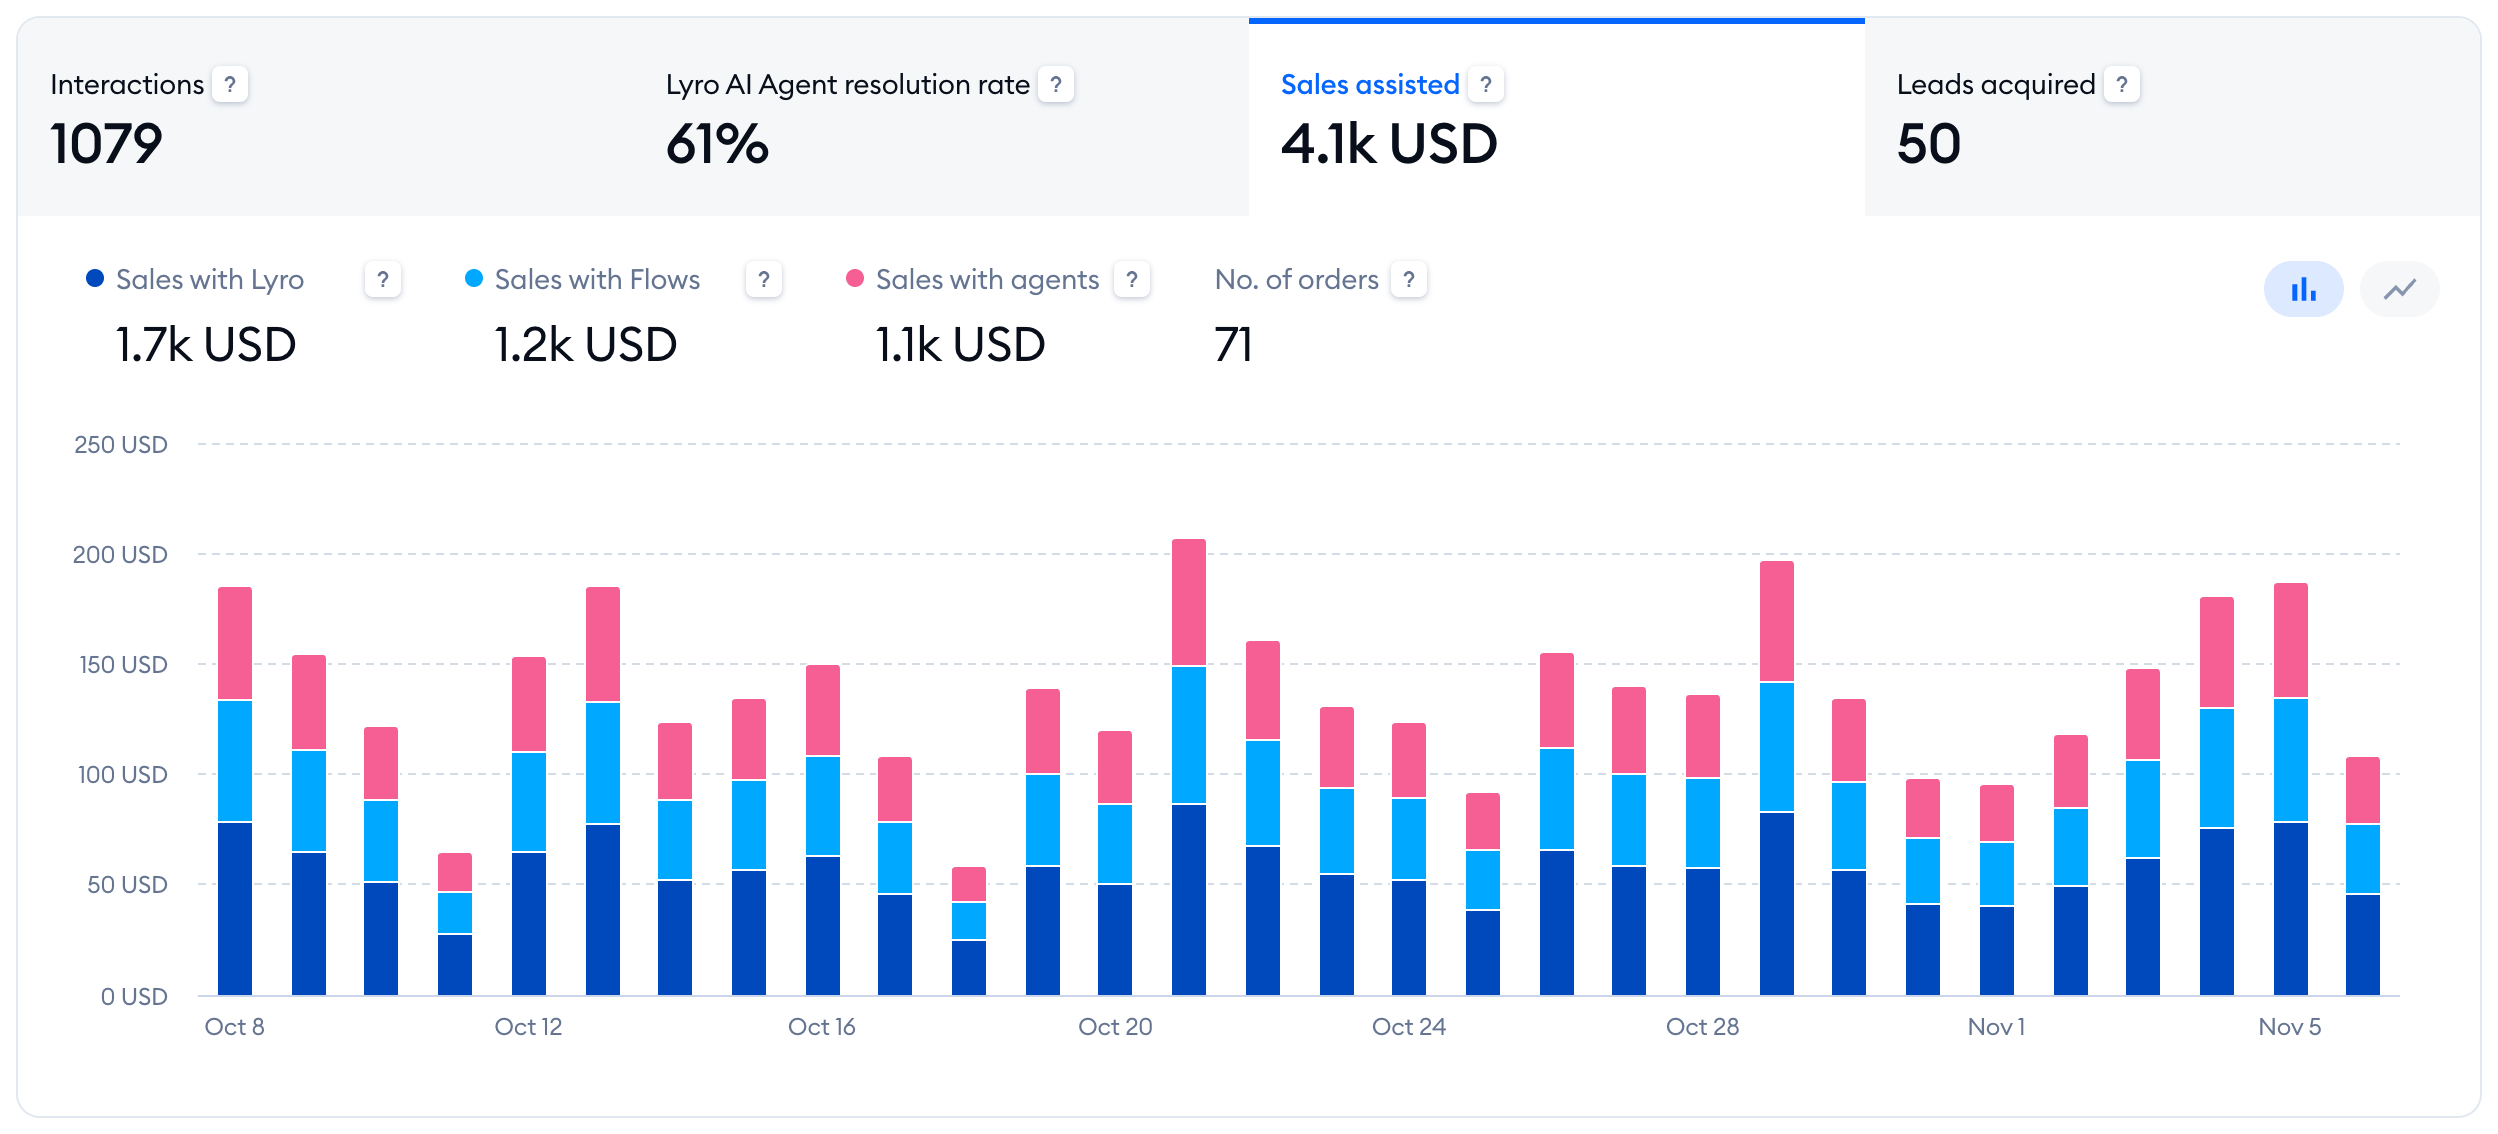
To see the value for a specific date, hover your cursor over a specific bar (or point) on the chart:
Leads acquired
In this tab, you can see the overall number of leads you've acquired in the selected timeframe, as well as two different metrics in the chart below:
- Leads from live conversations
- Leads from Flows
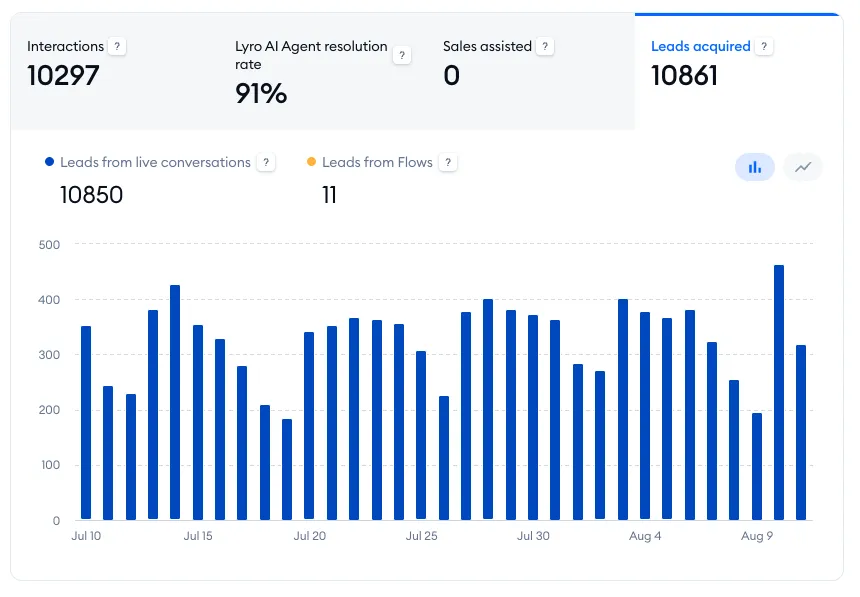
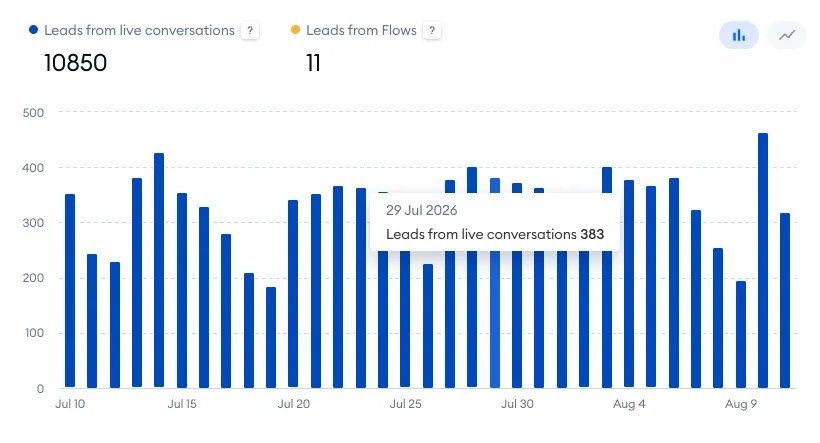
To see more details, hover your cursor over a specific bar (or point) on the chart:
Human support
The Human support panel includes four separate tabs, each with its own insights into different aspects of your Tidio project:

Live conversations
At Tidio, we define a conversation as an exchange of messages between a visitor and an agent (or agents).
The conversation starts with a new message, and it can be ended in two ways:
- The agent solves the conversation in the Tidio panel
- There are no new messages in the conversation for 3 hours (the chat will not disappear from the My Open conversations section in the Tidio panel; it still needs to be solved manually)
The data will be updated whenever the two events above occur.
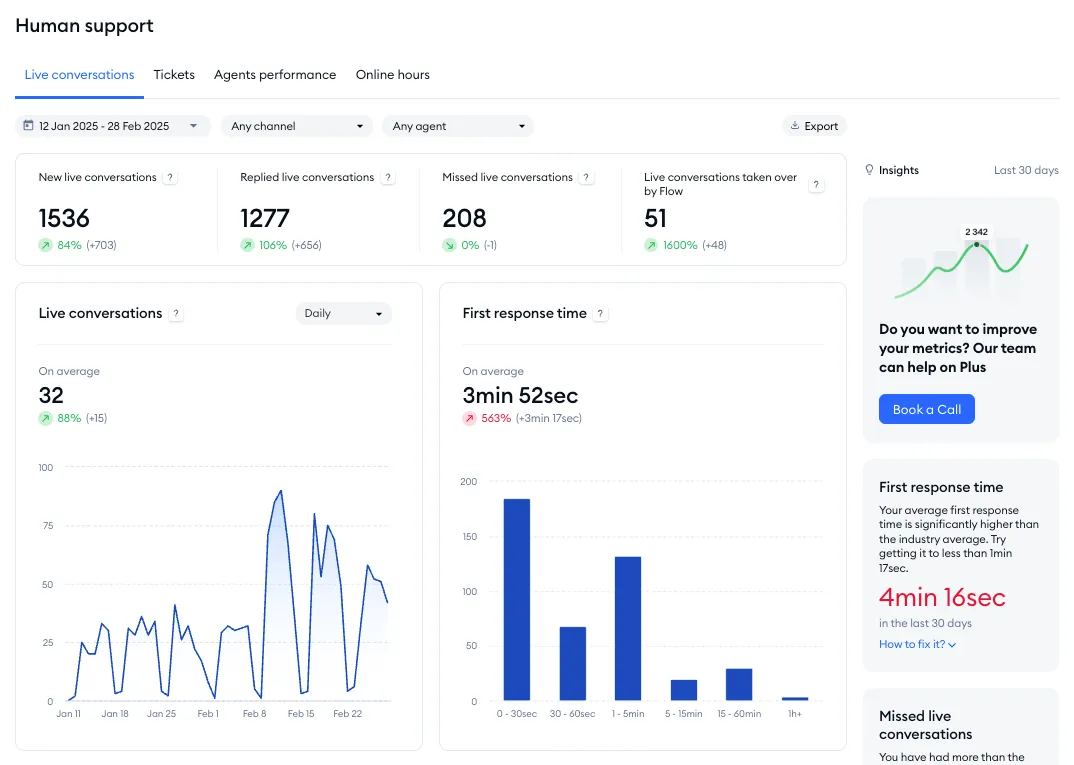
The Live conversations tab allows you to check aggregated data about the conversations you've had with your customers. At the top, you can decide about the timeframe you want to analyze (by selecting a range of dates or specific date from the calendar); the channel(s) you'd like to analyze; and the agent(s) whose performance you'd like to check. You also get the option to export all your data and receive it via email. This tab also shows you some useful insights from the last 30 days on the right (see Insights below).
You'll also see four general metrics:
- New live conversations
- Replied live conversations
- Missed live conversations
- Live conversations taken over by flow
New live conversations
The total number of all conversations you've had; the sum of conversations started by visitors and agents.
Replied live conversations
Conversations that received a reply from the agent or were started by agents.
Missed live conversations
Conversations started by visitors and haven't received a reply from an agent within 3 hours. If the agent responds after 3 hours, their message will be counted as a new conversation.
Live conversations taken over by flow
Conversations that initially appeared in the Unassigned folder, but were left without a response from a live agent. These conversations have eventually been handled by a flow, and hence disappeared from the Unassigned folder.
Below the metrics described above, you will find five charts:
- Live conversations
- First response time
- Satisfaction rate
- Conversation duration
- Conversations started by visitors
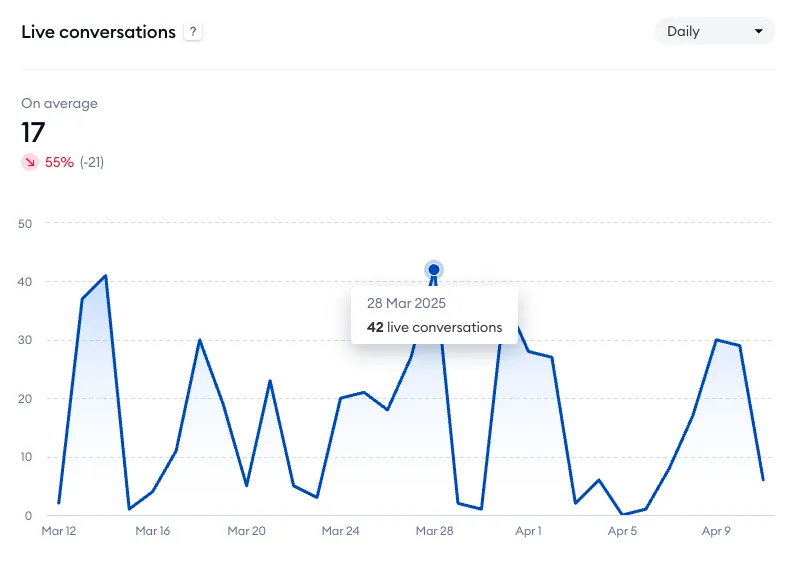
Live conversations
The number of conversations per day or month. Hover your cursor over a specific point on the chart to see more details. You can also see the average time calculated in the top-left.
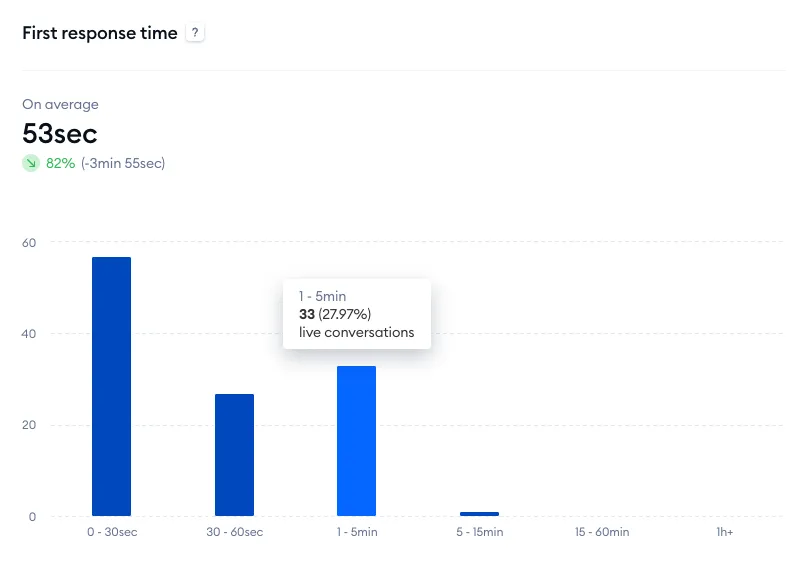
First response time
This metric defines the time your visitors have waited for the agents' first response. This is only counted for conversations that visitors start. On the chart, you'll see the average first response time and the number of conversations that received their first response within a specific timeframe. Hover your cursor over a specific column on the chart to see more details. You can also click on a column to see an even more detailed chart.
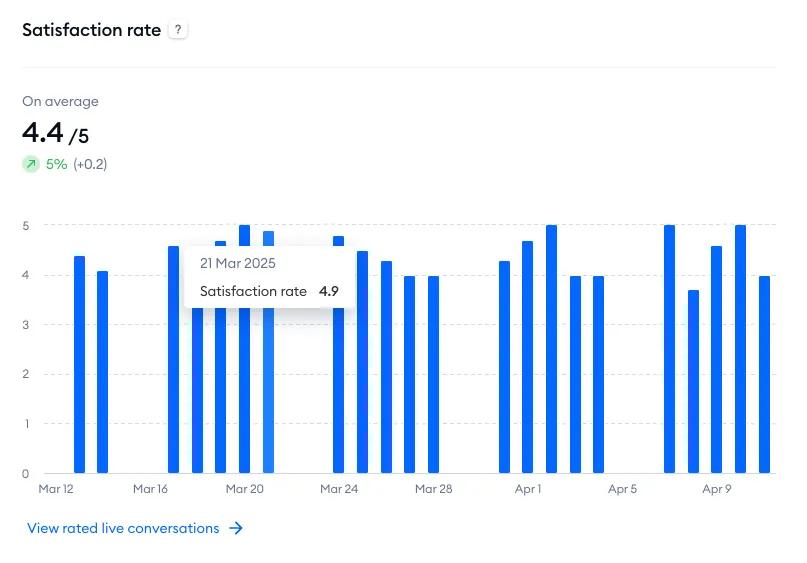
Satisfaction rate
An average of the ratings you've gathered as well as specific scores for each day. Hover your cursor over a specific point on the chart to see more details.
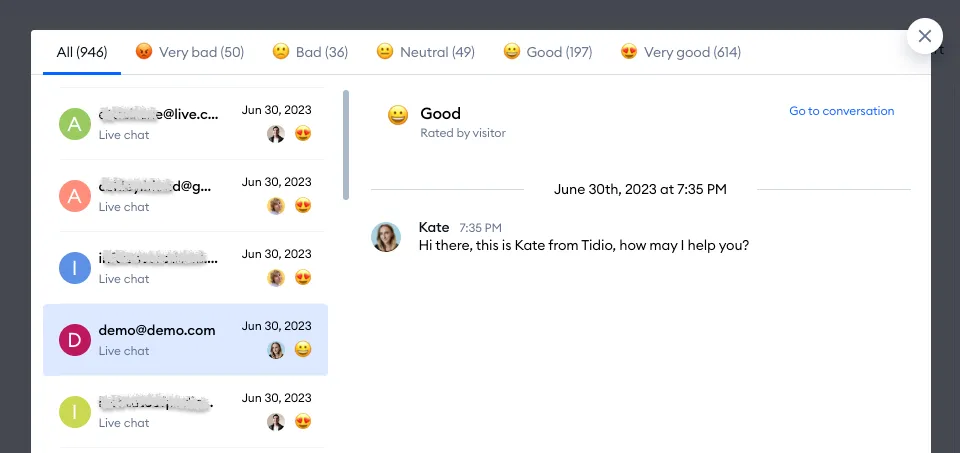
With the View rated live conversations option at the bottom, you can check the details of all rated conversations to find strong and weak points of your agents' performance.
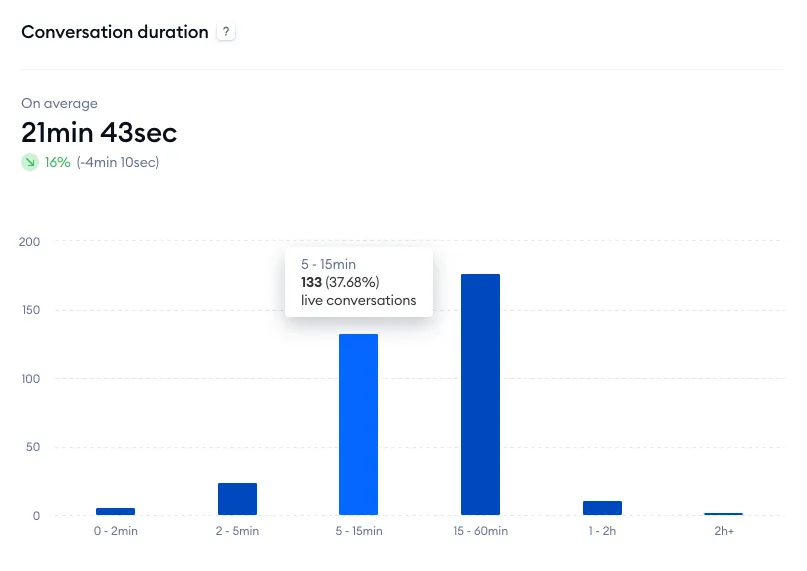
Conversation duration
You can see your average live chat duration, as well as the number of conversations divided into different duration groups. Hover your cursor over a specific column on the chart to see more details. You can also click on a column to see an even more detailed chart.
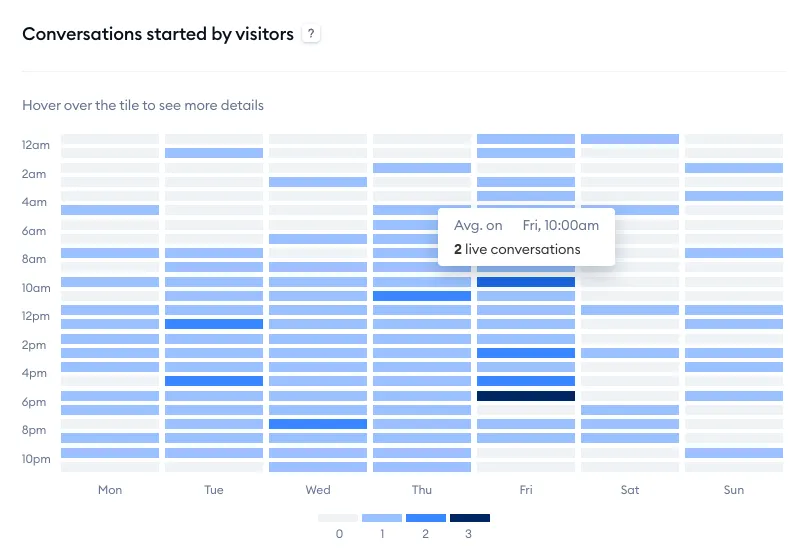
Conversations started by visitors
This chart lets you check how many visitors started conversations during specific hours on particular days. You can treat it as the basis for preparing your agent's schedule, so that your team can cover the most demanding traffic efficiently. Hover your cursor over a specific tile to see more details.
Insights
On the right of the Live conversations tab, the Insights panel shows how your live chat did in the Last 30 days, whatever dates you pick for the report, and compares it with other Tidio projects:
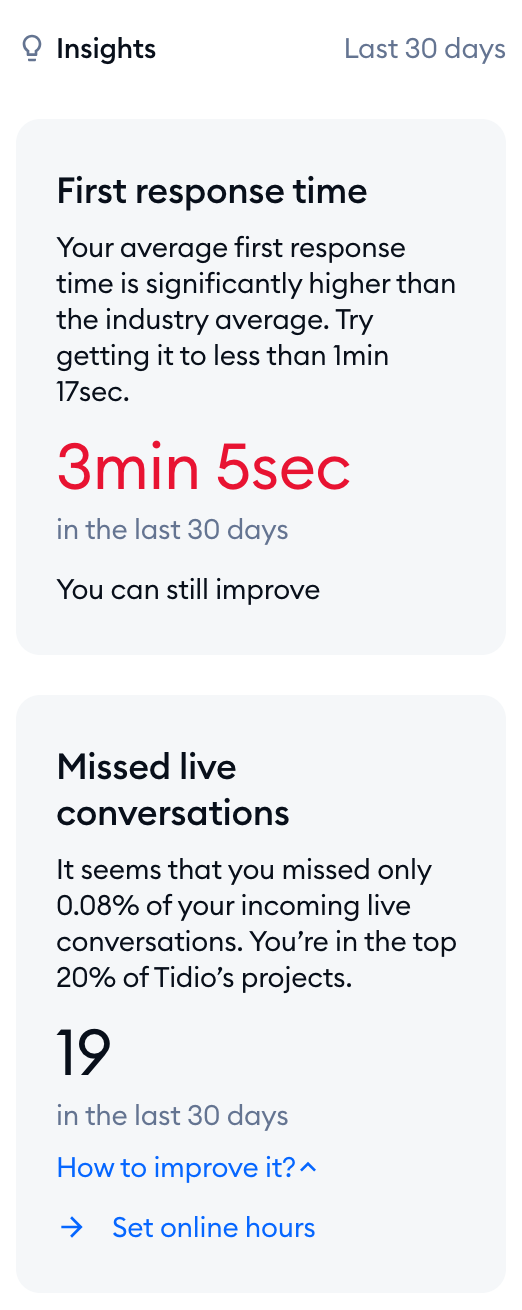
- First response time - your average first response time. If it's in the top 10% or top 20% of Tidio's projects, the card says so; if not, it suggests a time to aim for.
- Missed live conversations - the share of incoming live conversations you missed, again placed in the top 10% or top 20% of Tidio's projects, or marked as more than average.
Each card comes with How to improve it? (or How to fix it?), a short list of steps that help, like Add Lyro, Install Tidio mobile app, Allow desktop notifications, Set online hours or Set departments. Click on a step to go straight to the right setting.
Please note: the cards need some data. First response time shows up after at least 5 live conversations with a first response in the last 30 days, and Missed live conversations after at least 5 live conversations; with fewer, you'll see a Live conversations card instead. The Insights panel is part of advanced analytics, so it's available on the Growth plan and above.
Tickets
The Tickets tab shows you the data regarding all your tickets. At the top, you can decide about the timeframe you want to analyze (by selecting a range of dates or specific date from the calendar); the channel(s) you'd like to analyze; the agent(s) whose performance you'd like to check; and any available ticket tags that you'd like to limit your metrics to.
You'll see four general metrics:
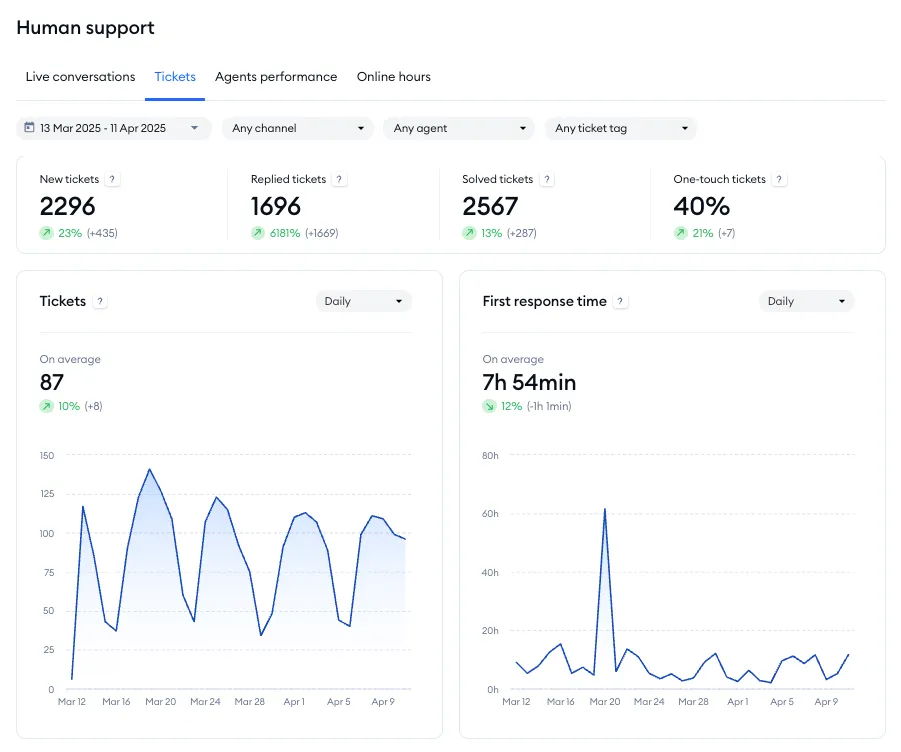
New tickets
The total number of unique tickets created within a particular timeframe, excluding those resolved solely by Lyro.
Replied tickets
The daily number of unique tickets that received at least one reply from an agent. Each ticket can only be counted once per day, but may appear on multiple days (if agent replies were submitted on separate days)
Solved tickets
The number of unique tickets that have been resolved and never re-opened.
One-touch tickets
The percentage of tickets that have been resolved with a single reply from an agent. This metric excludes tickets solved by Lyro or automated workflows, as well as those created from within the Tidio panel.
Below the metrics mentioned above, you will see five charts:
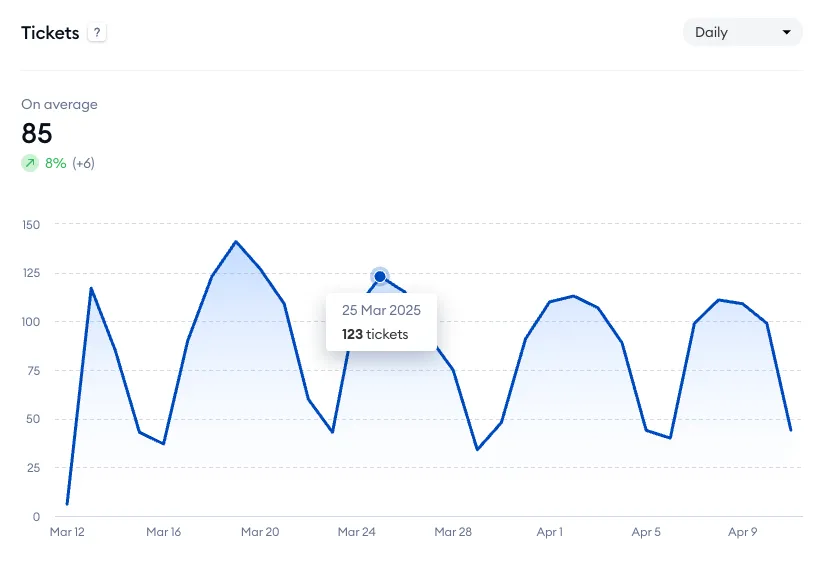
Tickets
The average number of tickets within a particular timeframe, either per day or per month. Hover your cursor over a specific point on the chart to see more details.
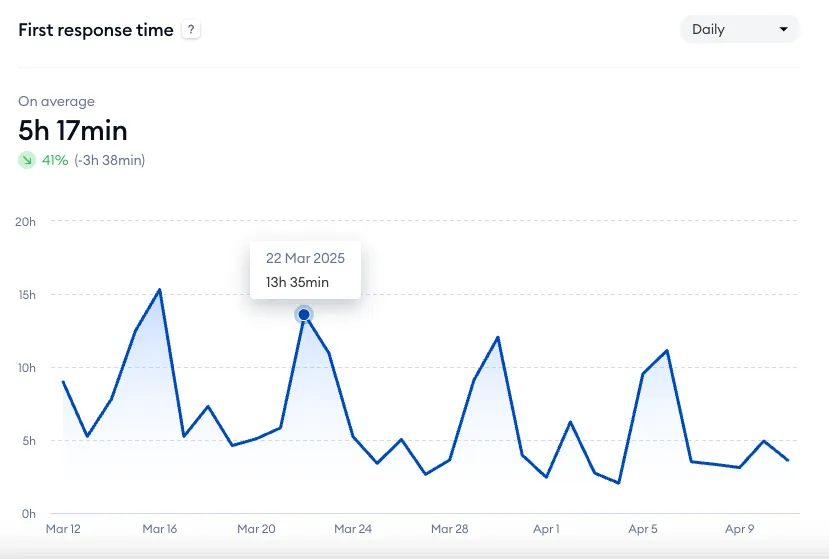
First response time
The average time needed for agents to respond to the first message in a ticket (either per day or per month). Hover your cursor over a specific point on the chart to see more details.
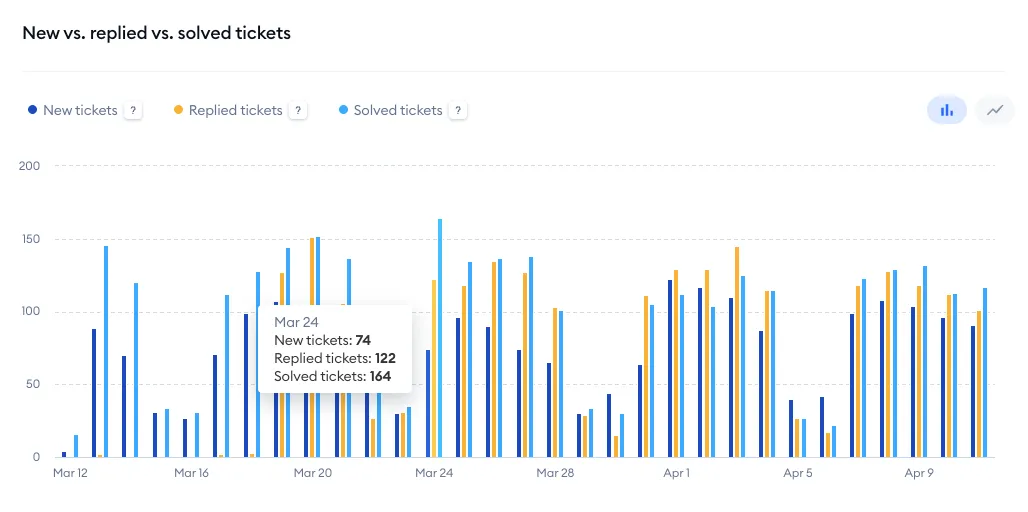
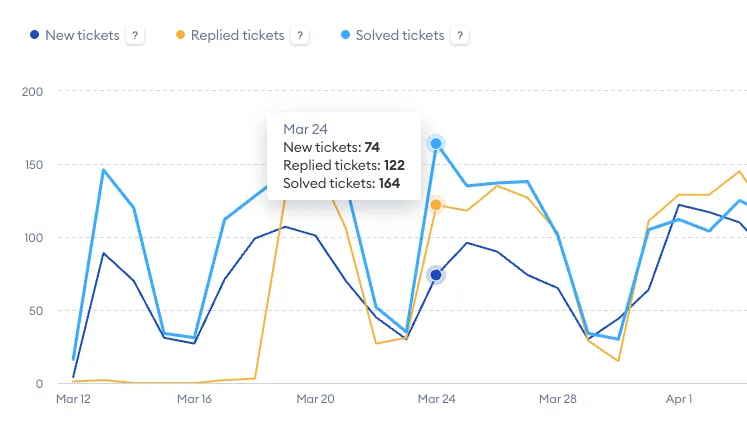
New vs. replied vs. solved tickets
This chart shows three metrics for a selected timeframe: new tickets, replied tickets, and solved tickets. Hover your cursor over a specific point on the chart to see more details.
Note that you can also switch between two modes: the bar chart and the line chart:
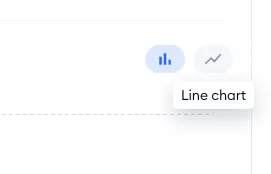
This will be helpful if you find one mode easier to read than the other with this particular chart:
Satisfaction Rate
The average of all ratings you've gathered (from the selected timeframe) as well as the ratings for each day separately. Hover your cursor over a specific column on the chart to see more details.
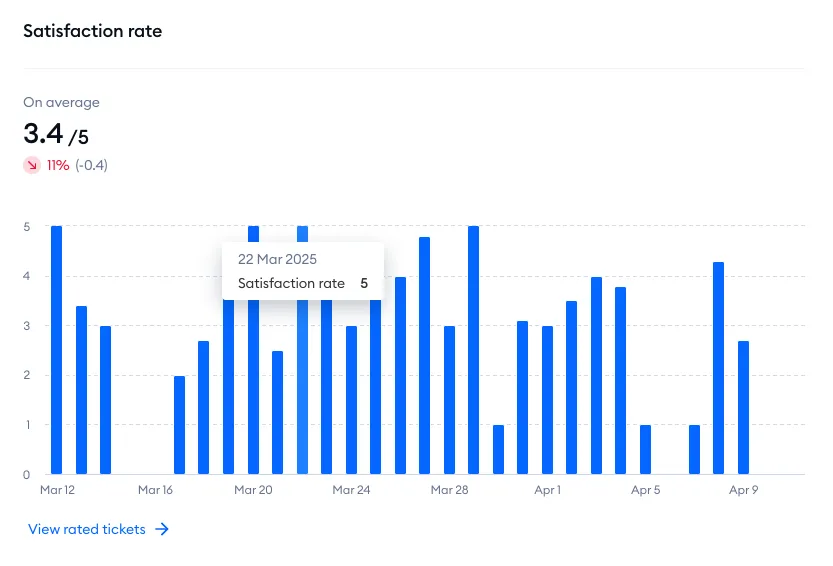
With the View rated tickets option at the bottom, you can check the details of all rated tickets to find strong and weak points of your agents' performance.
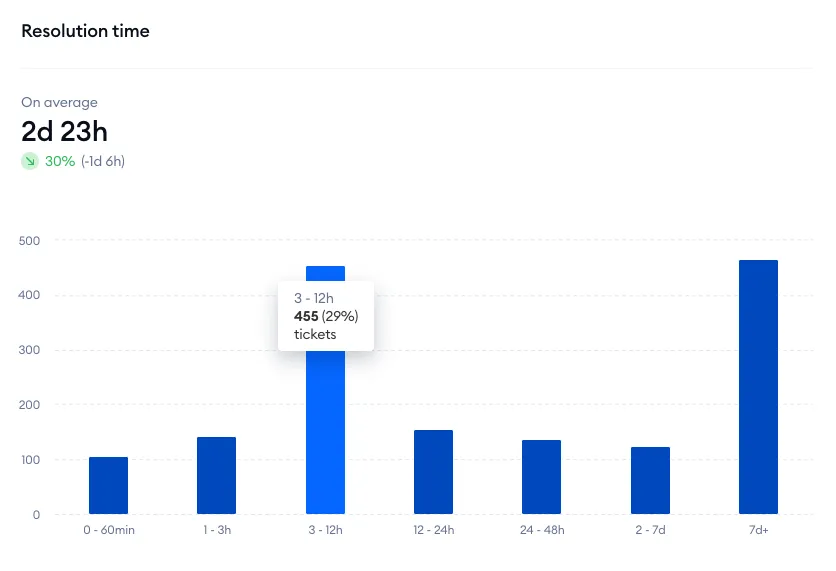
Resolution time
This chart shows how long it usually takes your team to solve a ticket. Hover your cursor over a specific column on the chart to see more details. You can also click on a column to see an even more detailed chart.
Agents performance
This tab allows you to assess your agents' overall performance by looking at their detailed metrics. You can choose a timeframe from the calendar menu in the top-left, as well as select a specific agent (or multiple agents) whose performance you'd like to analyze.
There are two separate lists available: one for conversation-related metrics, and the other for ticket-related metrics.
In the Live conversations list, you can see all your agents with their individual metrics:
- Replied live conversations
- Online hours
- Live conversations per hour
- First response time
- Satisfaction rate
- Conversation duration
You can sort the list by each column, and see each agents' rated conversations (by using the button on the far right).

Replied live conversations
The agent's total number of handled conversations (within the selected timeframe).
Online hours
The agent's total amount of time during which their status was online.
Live conversations per hour
The agent's average amount of conversations per hour.
First response time
How long the visitors have waited for the agent's first response in new conversations, on average.
Satisfaction rate
The agent's average rating, calculated from the ratings left by users on chat.
Conversation duration
The agent's average conversation time.
The Tickets list is very similar to the Live conversations list described above, but has slightly different metrics available. Again, you can see a list of all your agents with their individual metrics:
You can sort the list by each column, and see each agents' rated tickets (by using the button on the far right).

Replied tickets
The agent's total number of handled tickets (within the selected timeframe).
Online hours
The agent's total amount of time during which their status was online.
Tickets per hour
The agent's average amount of tickets handled per hour.
First response time
How long the users have waited for the agent's first response in a ticket thread, on average.
Satisfaction rate
The agent's average rating, calculated from the ratings left by users via email.
Online hours
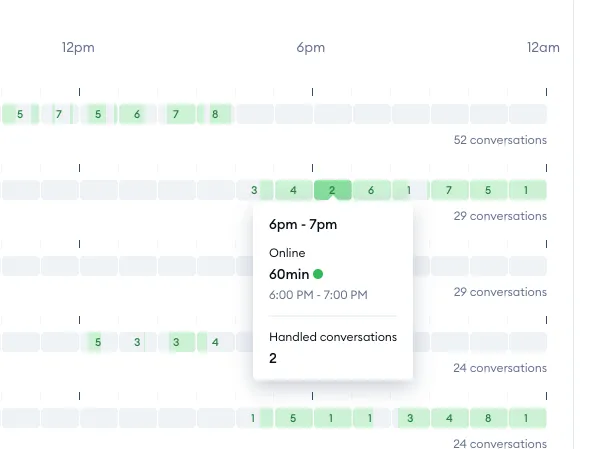
This tab allows you to see the exact periods of time during which each agent was online, and how many conversations they've handled during those periods. You can select a specific date from the calendar menu in the top-left, and decide which agent(s) you'd like to see listed with their recorded online hours.
You can see three general metrics as well:
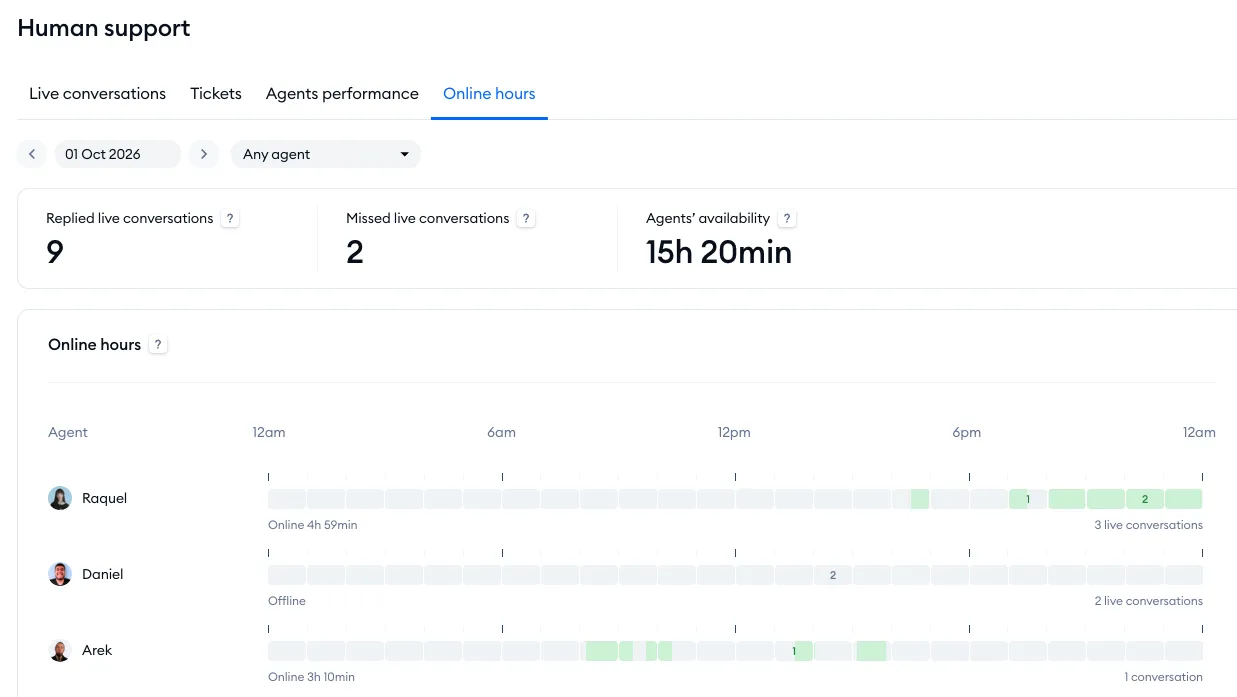
Replied live conversations
The total number of conversations where the visitor received a reply (or where the conversation was started by an agent), on the selected day.
Missed live conversations
The total number of conversations where no agent responded within 3 hours since the visitor's most recent message (on the selected day).
Agents' availability
The overall amount of time during which at least one agent was online on the selected day.
Below the metrics listed above, you can see a list of all your selected agents along with their individual online time, and the overall number of their conversations. Hover your cursor over particular blocks to see more details about that specific period of the day:
AI support
The AI support panel grants you access to various Lyro-related metrics. Please note that it's available on every plan, including Free - just like the Overview and Leads. For more about Lyro's own reports, see Lyro Analytics.
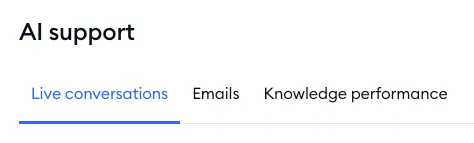
This panel is comprised of three separate tabs, each providing insights into the different ways your users interact with Lyro:
Live conversations
In this tab, you can see Lyro metrics associated with live conversations. At the top, you can select a timeframe that you'd like to analyze (using the calendar menu) and decide whether you'd like to check the metrics on a daily or monthly basis.
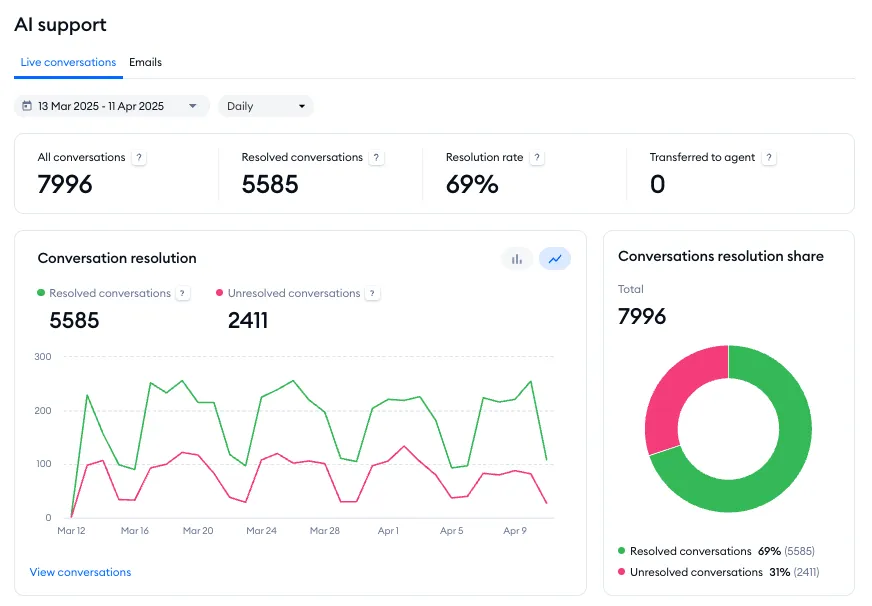
There are four general metrics available:
All conversations
The number of all live conversations that Lyro has handled (in the selected timeframe).
Resolved conversations
The number of all visitor questions that have been resolved by Lyro in general, without any agent's assistance (where the visitor either left the conversation or hasn't asked for a live agent's assistance).
Resolution rate
The percentage of all resolved conversations where Lyro provided an answer, without any agent's assistance.
Transferred to agent
The total number of questions where the visitor has asked to speak with a live agent.
Below the metrics listed above, you can see seven charts:
- Conversation resolution
- Conversations resolution share
- Resolution rate
- Asked questions
- Answer rate
- Answers by intent
- Satisfaction rate
Conversation resolution
This chart shows two separate metrics: Resolved conversations (the total number of conversations where Lyro provided an answer, and the problem was solved) and Unresolved conversations (the total number of conversations where Lyro provided an answer, but the problem wasn't solved).
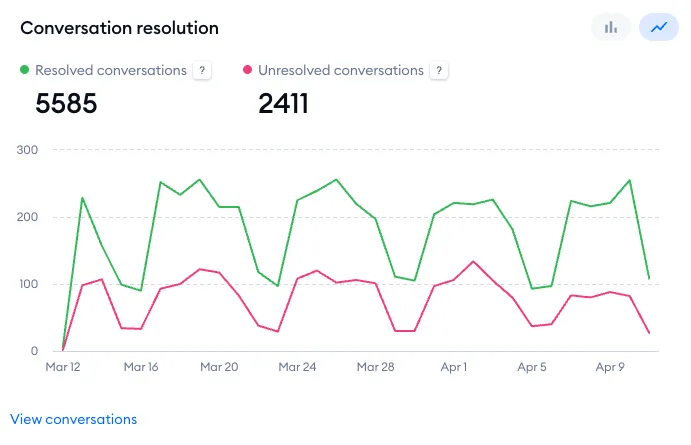
Hover your cursor over a specific point to see more details:
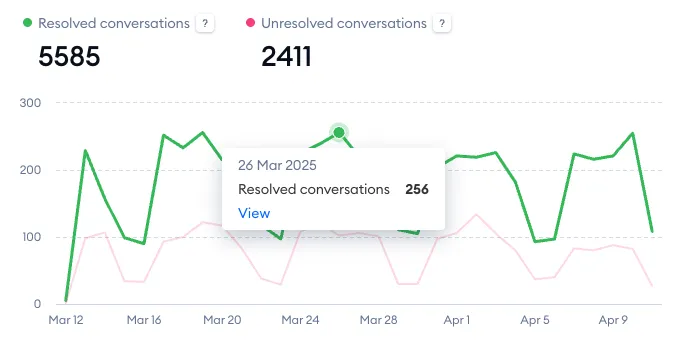
Note that you can switch between two modes here as well: line chart or bar chart:
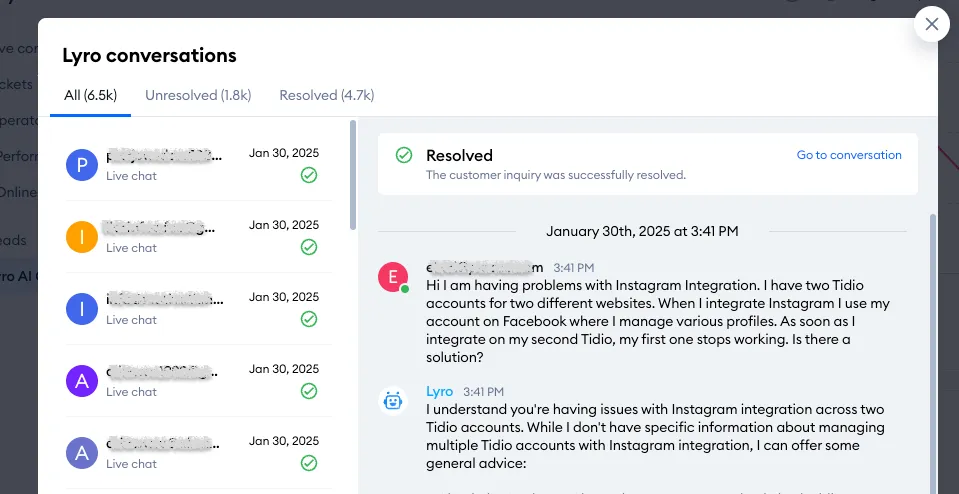
In the bottom-left of the chart, you can use the View conversations link and access all of Lyro's conversations from the selected timeframe. This allows you to see all of the chat transcripts, or just the resolved or unresolved ones:
Conversations resolution share
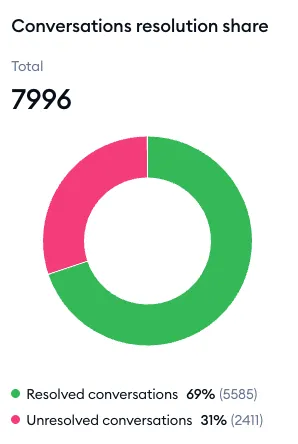
On the right, you can see the circular Conversations resolution share chart; it shows the total number of conversations handled by Lyro, as well as the percentage of Resolved and Unresolved conversations:
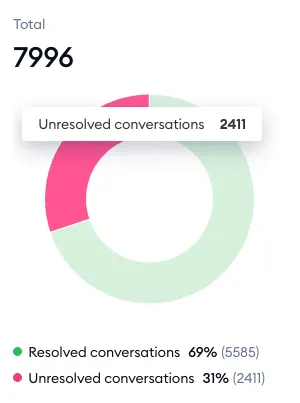
You can hove your cursor over one of the shares to see the exact number as well:
Resolution rate
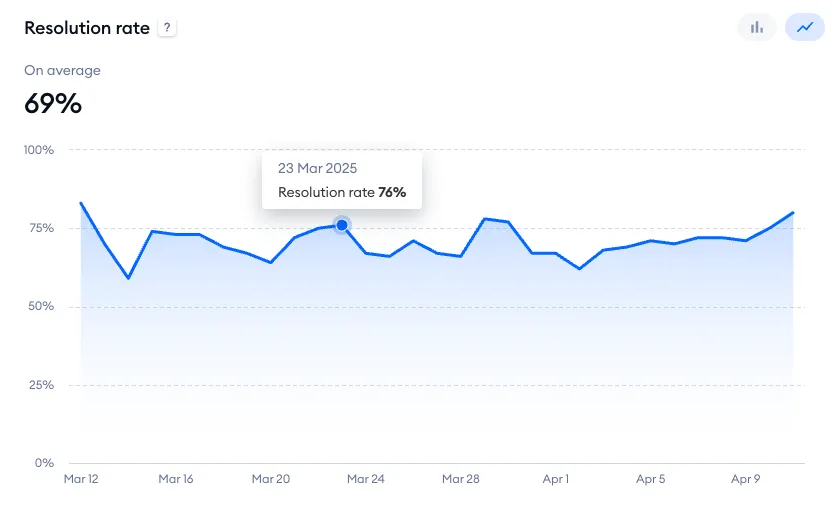
This chart shows the percentage of conversations where Lyro provided an answer and the visitor either left or hasn't asked for live agent assistance. Hover your cursor over a specific point to see more details. You can switch between a line chart and bar chart mode here as well.
Asked questions
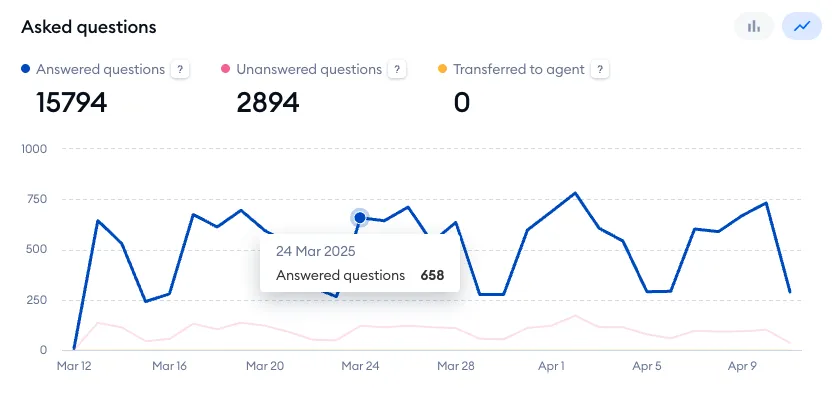
This chart shows three separate metrics: Answered questions (the total number of questions Lyro has been able to answer); Unanswered questions (how many questions Lyro hasn't been able to answer); and Transferred to agent (how many times a conversation has been transferred to a live agent for assistance). Hover your cursor over a specific point to see more details. You can switch between a line chart and bar chart mode here as well.
Answer rate
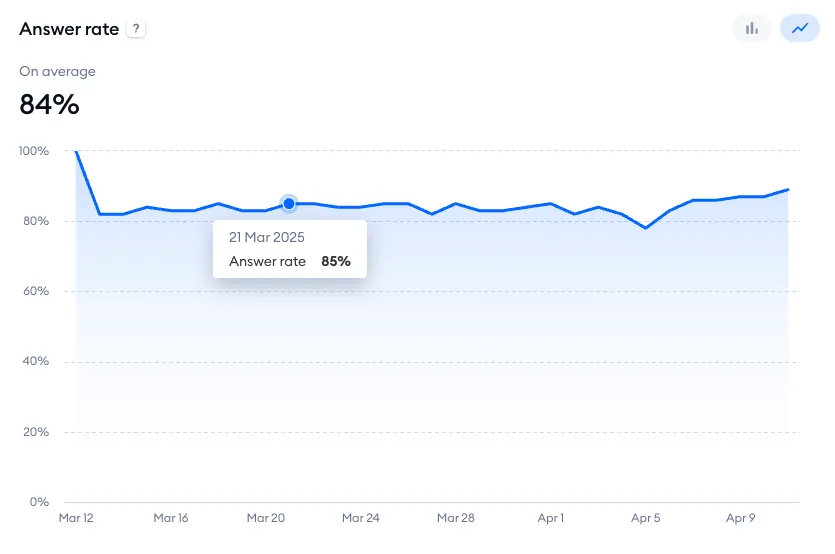
This chart shows the percentage of all visitor questions that have been answered by Lyro. Hover your cursor over a specific point to see more details. You can switch between a line chart and bar chart mode here as well.
Answers by intent
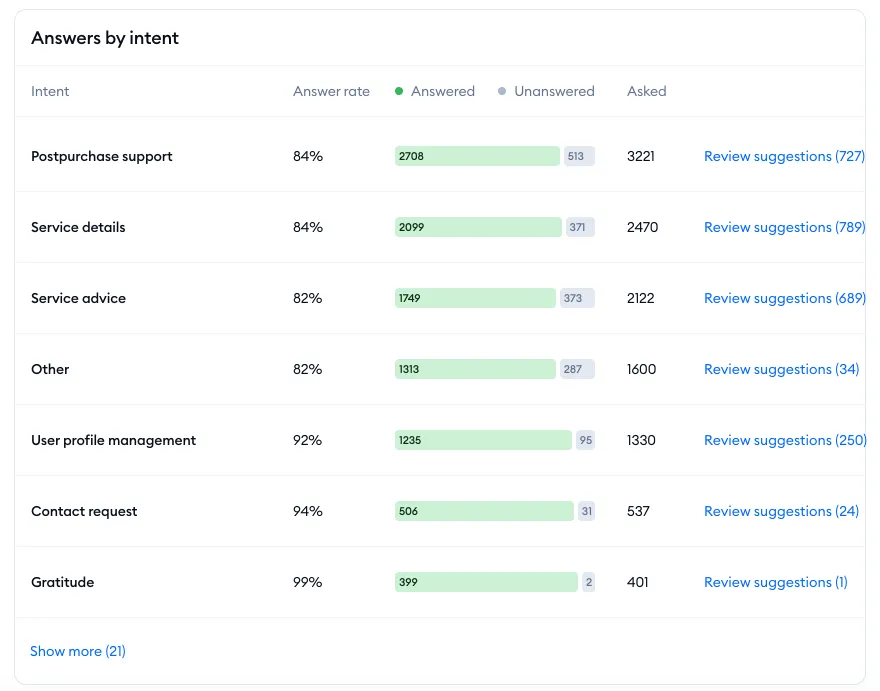
This list shows the most common topics that visitors ask about, as understood by Lyro AI. These intents are listed from the most common to the least common (you can use the Show more link at the bottom to see the complete list).
Each intent has several metrics displayed: the answer rate, the ratio of answered to unanswered, and the exact number of times the intent has been detected by Lyro. You can also access Lyro's Suggestions section by clicking on the Review unanswered link on the right of every intent; this will let you see the entire list of individual questions that Lyro failed to answer successfully, for that particular intent.
Satisfaction rate
This chart represents Lyro's satisfaction score over time, calculated from the ratings left by visitors. Hover your cursor over a specific point to see more details. You can switch between a line chart and bar chart mode here as well.
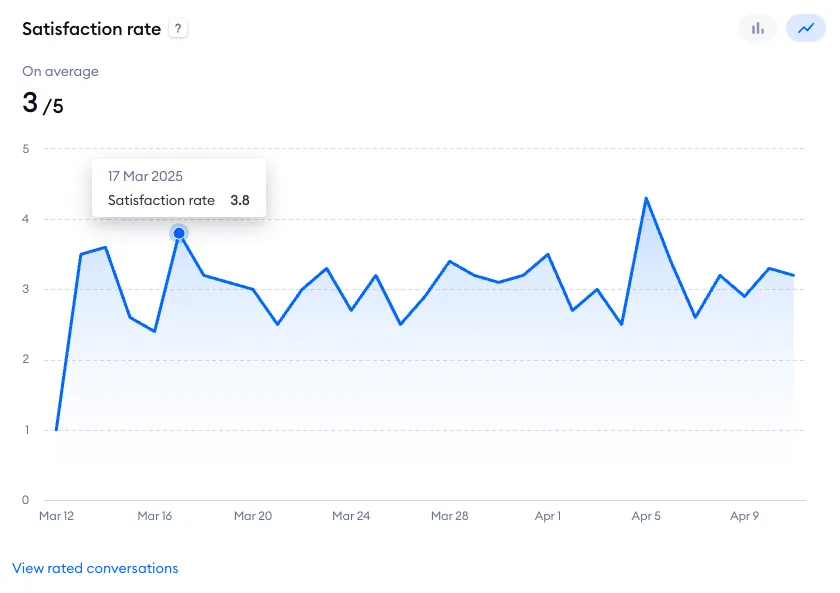
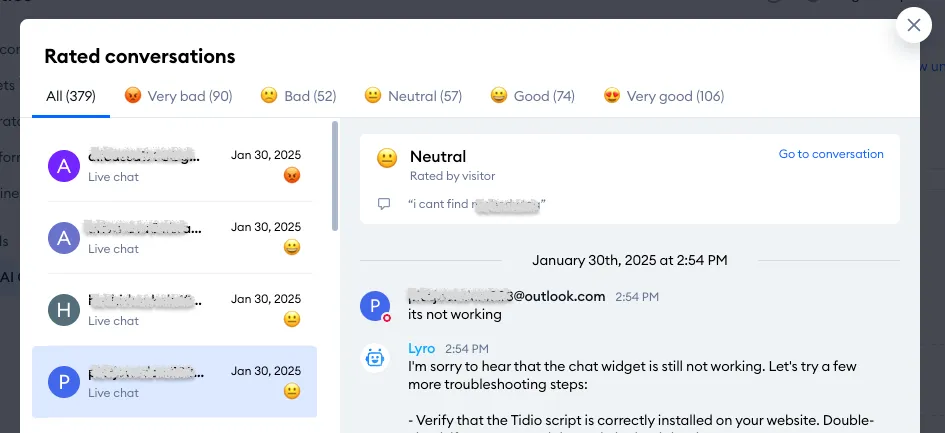
You can access a list of all rated Lyro conversations by clicking on the View rated conversations link at the bottom of the chart:
Emails
In this tab, you can see Lyro metrics associated with tickets (email threads). At the top, you can select a timeframe that you'd like to analyze (using the calendar menu) and decide whether you'd like to check the metrics on a daily or monthly basis.
There are four general metrics available:
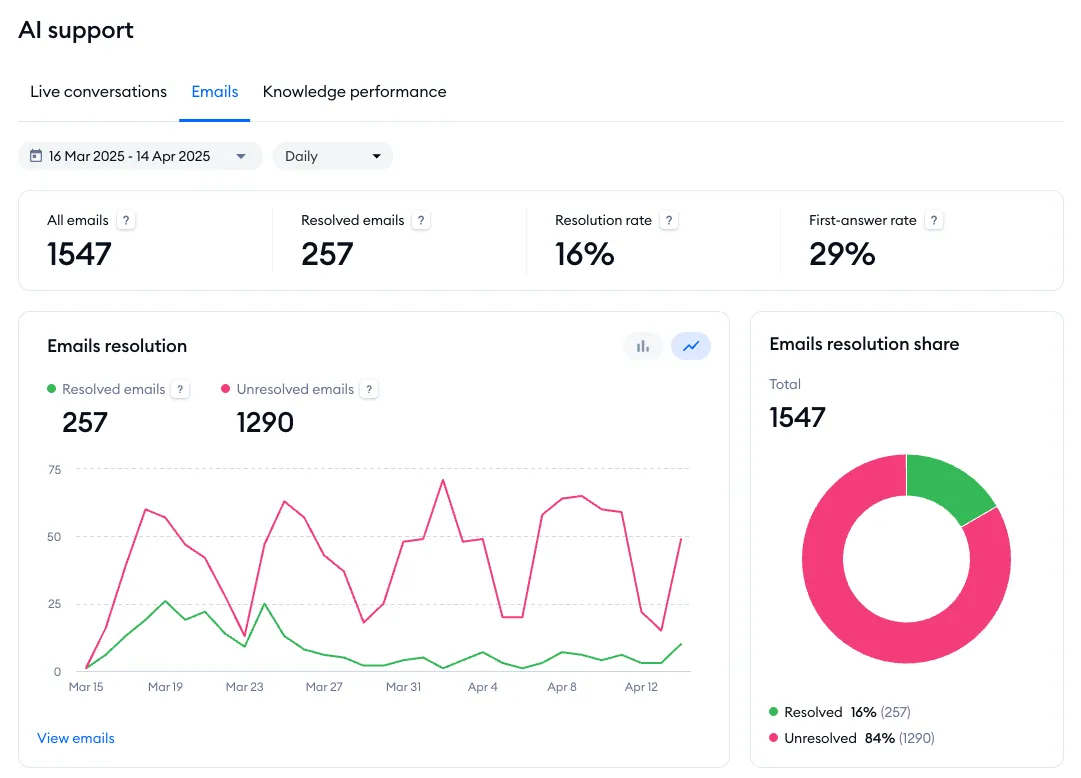
All emails
The number of all emails that Lyro has handled (in the selected timeframe).
Resolved emails
The number of all tickets that have been resolved by Lyro in general, without any agent's assistance.
Resolution rate
The percentage of all resolved tickets where Lyro provided an answer, without any agent's assistance.
First-answer rate
The percentage of first emails answered by Lyro.
Below the metrics listed above, you can see six charts:
- Emails resolution
- Emails resolution share
- Answers to first emails
- Resolution rate
- First-answer rate
- Satisfaction rate
Emails resolution
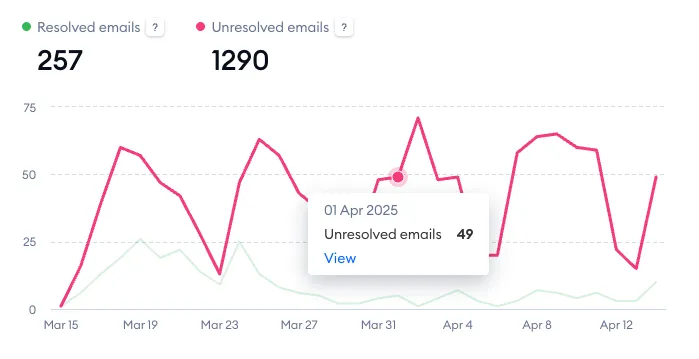
This chart shows two separate metrics: Resolved emails (the number of emails solved by Lyro without any agent assistance) and Unresolved emails (the number of emails not fully resolved by Lyro; the customer responded in the ticket and a live agent was needed). You can switch between a line chart and bar chart mode here as well. Please note the View emails link in the bottom-left as well; it allows you to see a list of all of the tickets that Lyro has handled. You can switch between a line chart and bar chart mode here as well.
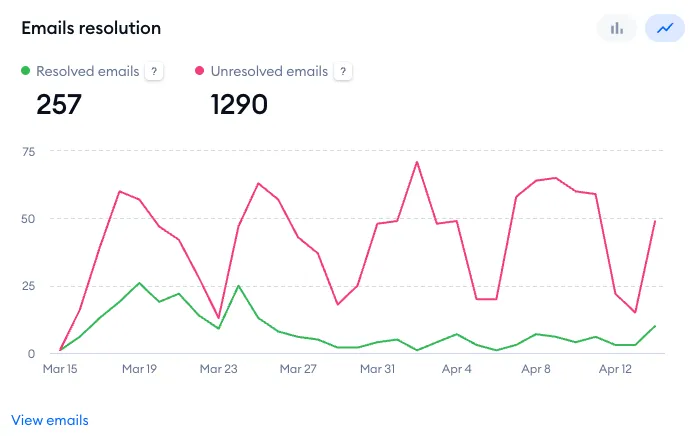
Hover your cursor over a specific point to see more details:
Emails resolution share
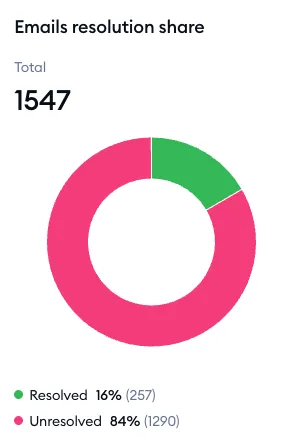
On the right, you can see the circular Emails resolution share chart; it shows the total number of tickets handled by Lyro, as well as the percentage of Resolved and Unresolved emails:
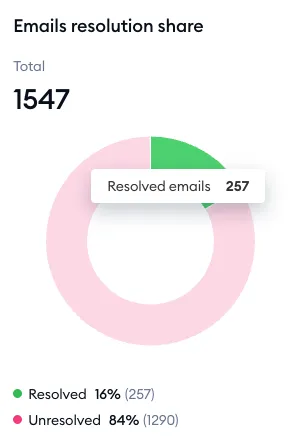
You can hove your cursor over one of the shares to see the exact number as well:
Answers to first emails
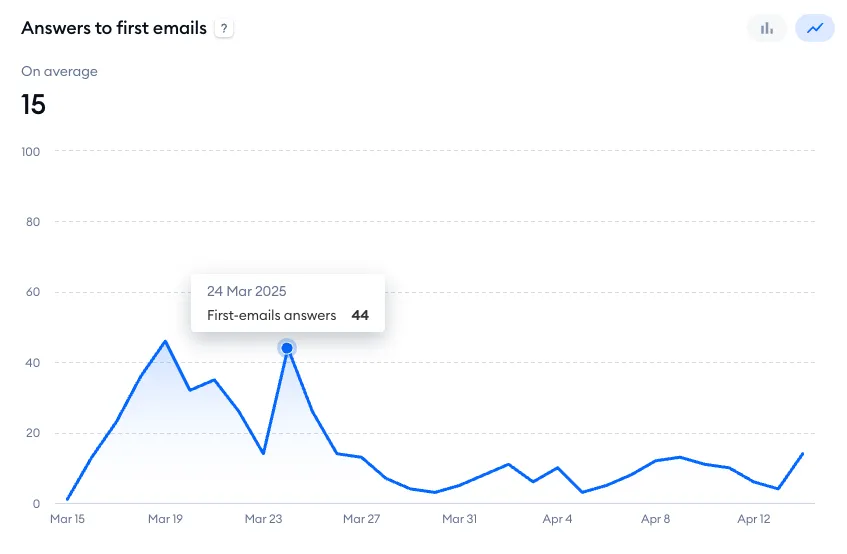
This chart shows the number of initial emails that have been answered by Lyro. This lets you see how well Lyro replies to the very first email in a thread. Hover your cursor over a specific point to see more details. You can switch between a line chart and bar chart mode here as well.
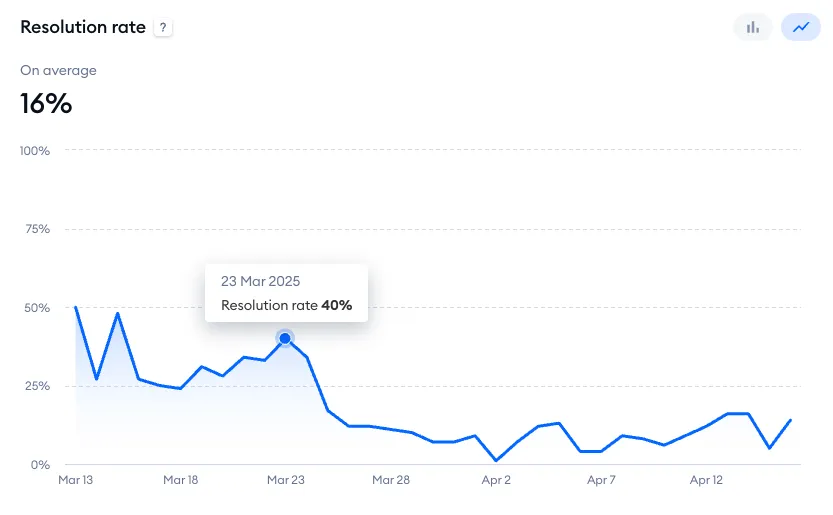
Resolution rate
This chart shows the percentage of tickets that Lyro has resolved without any agent assistance. Hover your cursor over a specific point to see more details. You can switch between a line chart and bar chart mode here as well.
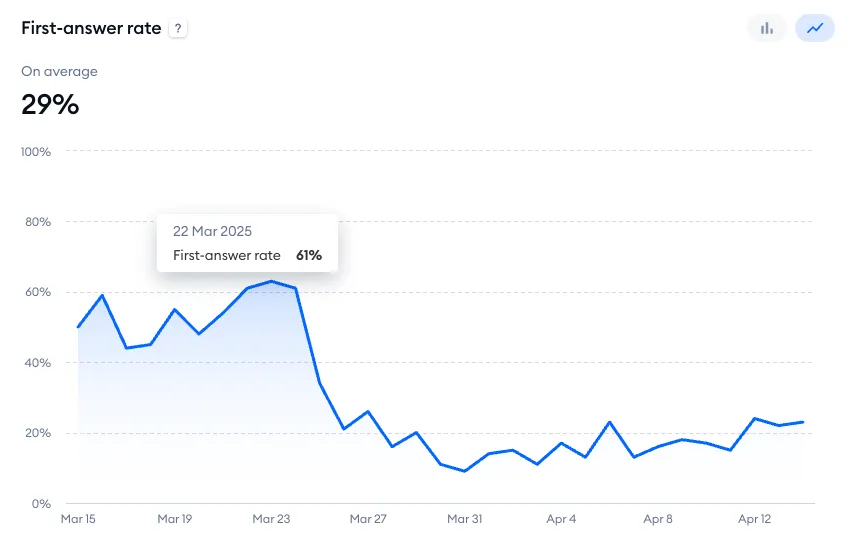
First-answer rate
This chart displays the percentage of Lyro's first-email replies. Hover your cursor over a specific point to see more details. You can switch between a line chart and bar chart mode here as well.
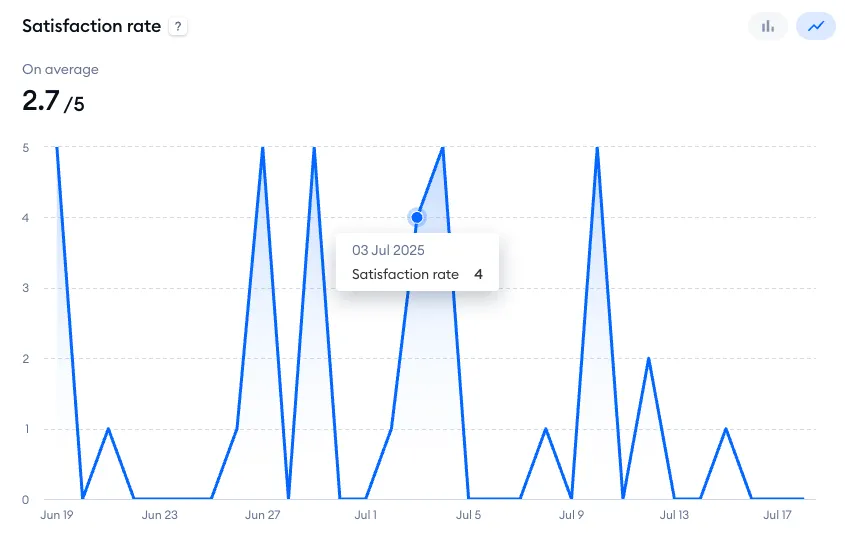
Satisfaction rate
An average of the ratings Lyro has gathered (for email responses) as well as specific scores for each day. Hover your cursor over a specific point to see more details. You can switch between a line chart and bar chart mode here as well.
Knowledge performance
In the Knowledge performance tab, you can find a list of the most often used question-and-answer pairs.
The list shows a maximum of 200 Q&As, sorted by popularity. It includes the Q&A source, the question itself, the total usage count, and the date of its most recent usage.
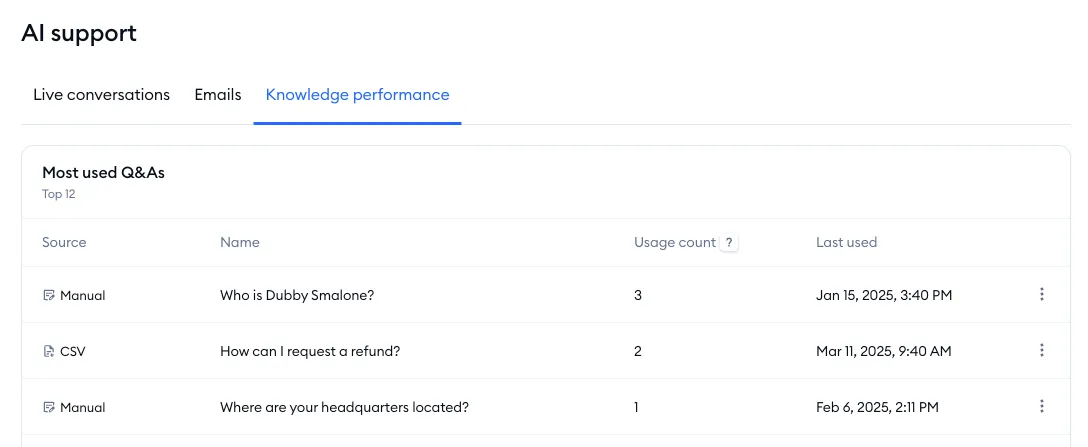
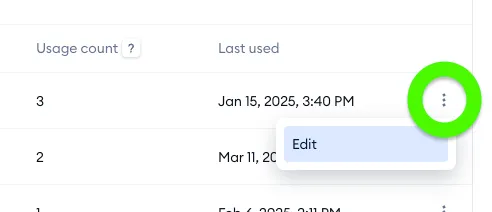
In addition to that, you can click on the three dots on the right, and use the Edit option:
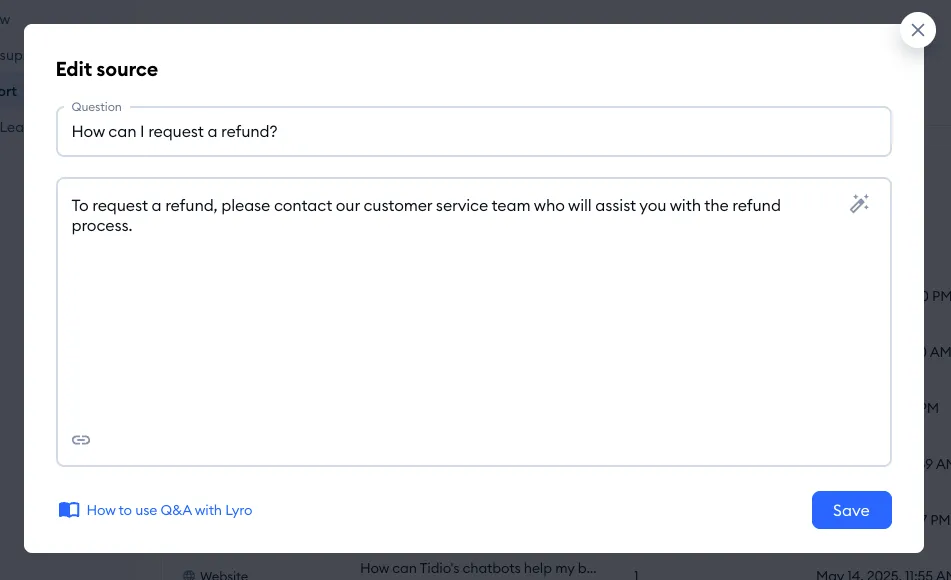
This way, you can actually view and modify the Q&A if necessary:
Leads
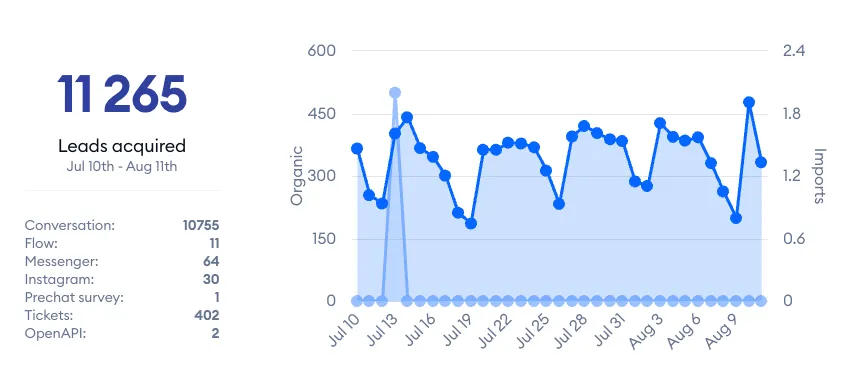
The Leads tab allows you to see how many leads have been collected by your agents (or Tidio's automation) in a specified timeframe. You can see the overall number as well as more detailed stats underneath, showing the lead sources. Leads is available on every plan.
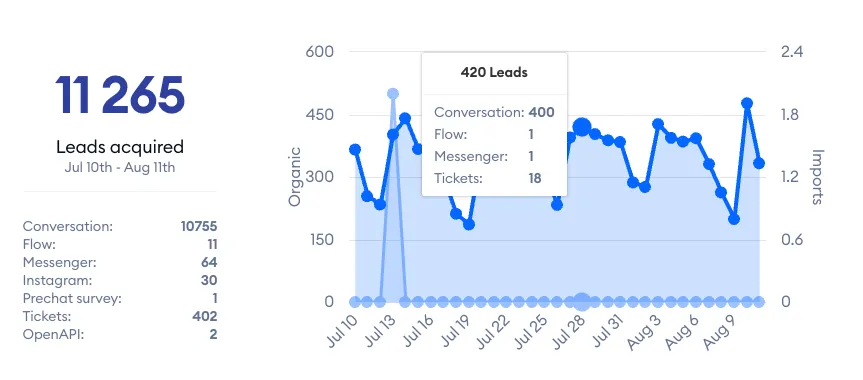
Hover your cursor over a specific point on the chart to see more details:
Sales (for Shopify-integrated projects)
The Sales section lets you see how Tidio helps you with your sales, your average order value, and which agents (or flows) generate the most sales.
Please note: the Sales section is part of advanced analytics, available on the Growth plan and above (the Sales assisted tab of the Overview is available on every plan). Order data may take up to one hour to appear in the reports.
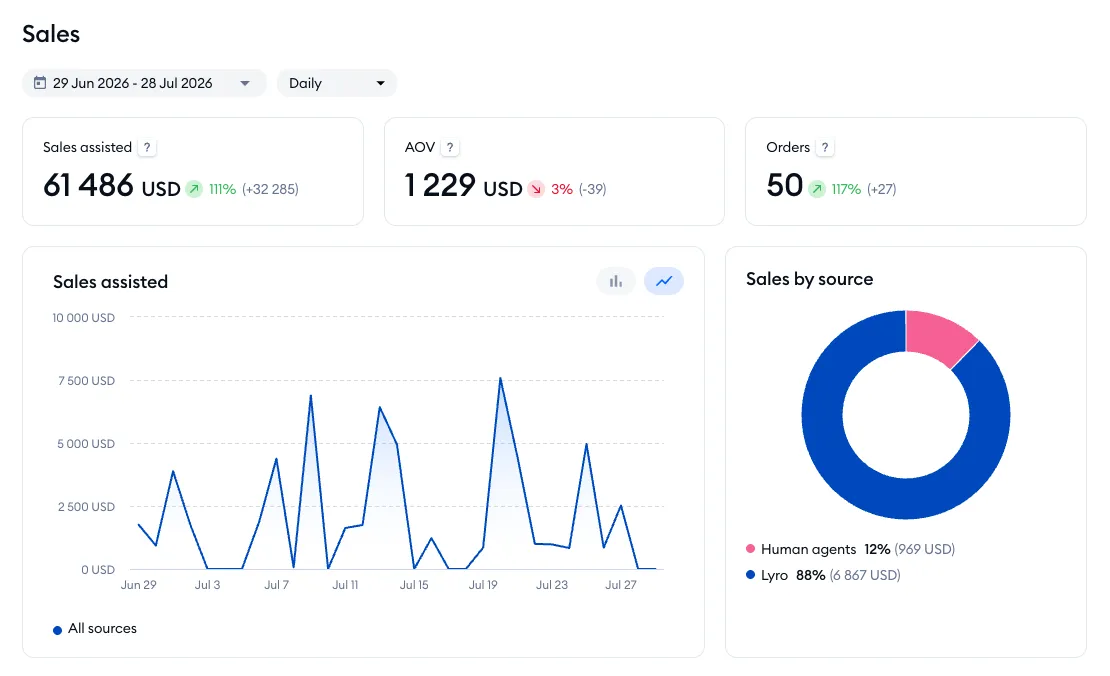
You can select a specific date or timeframe that you're interested in by using the calendar menu in the top-left of the Sales section. At the top of this section, you will also see three general metrics:

Sales assisted
The total sales revenue from all orders, generated with the assistance of Tidio (attributed to Lyro, agents, and flows).
AOV
The average order value from sales assisted by Tidio (attributed to Lyro, agents, and flows).
Orders
A total number of orders assisted by Tidio.
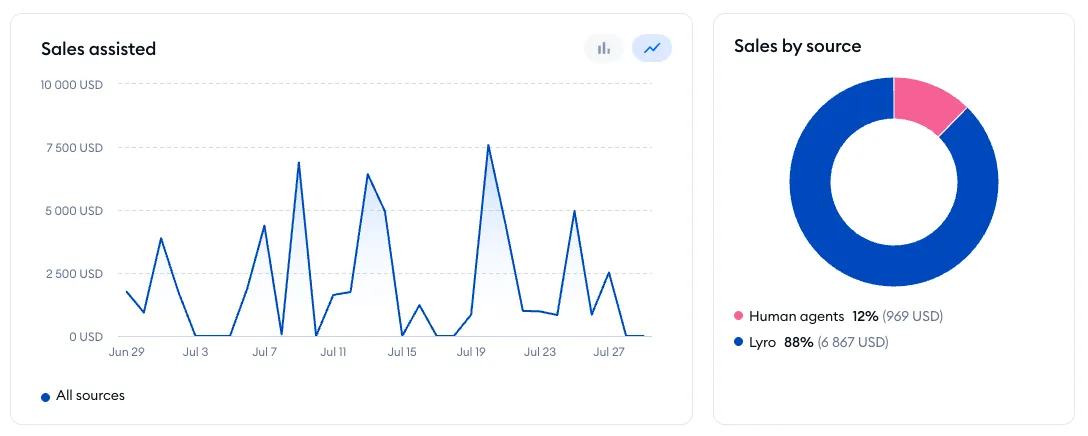
Underneath, you will find two additional graphs:
- Sales assisted (which shows the value of sales over time)
- Sales by source (which shows the percentage of sales shared between Lyro, flows, and live agents)
Below these graphs, you will see three additional tabs, with more details in each:
Sales metrics for Lyro
Inside the Lyro tab, you will find metrics related to AI-assisted sales, as well as Lyro's product recommendations and product-related answers.
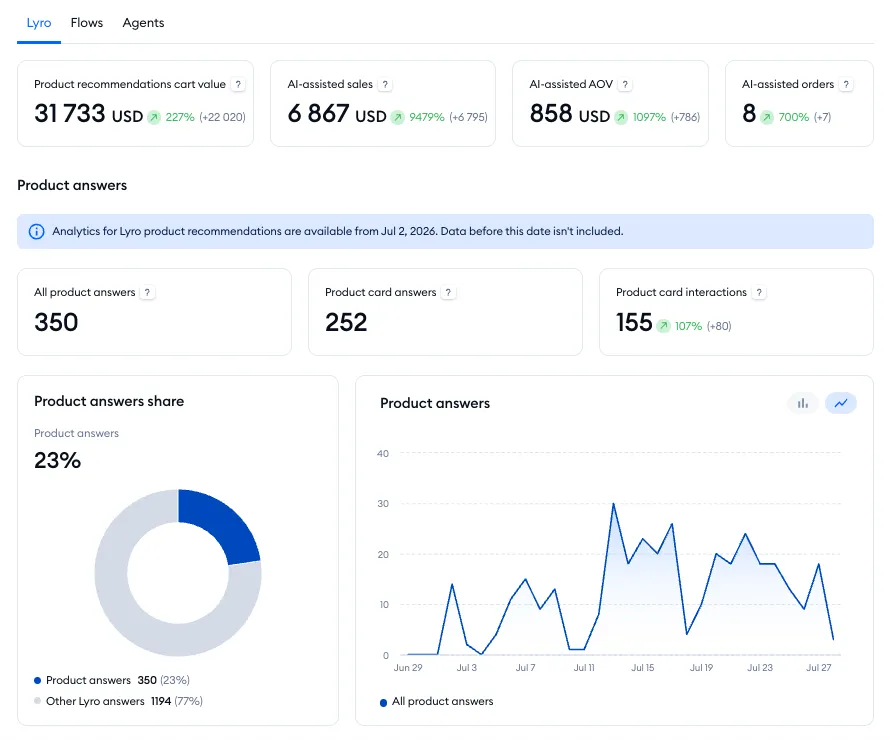
At the top, there are four metrics available:
Product recommendations cart value
The total value of products that visitors added to their carts after engaging with Lyro's product recommendations.
AI-assisted sales
The revenue from paid orders where customers engaged with Lyro's product recommendations before purchasing.
AI-assisted AOV
The average order value for orders purchased by customers after engaging with Lyro's product recommendations.
AI-assisted orders
The number of paid orders purchased after engaging with Lyro's product recommendations.

Below that, there is the Product answers section with several other metrics:
All product answers
The number of Lyro responses to product-related questions, using knowledge from your product database.
Product card answers
The number of Lyro responses that included product cards.
Product card interactions
The number of clicks on product cards, including card clicks as well as Add to cart button clicks.

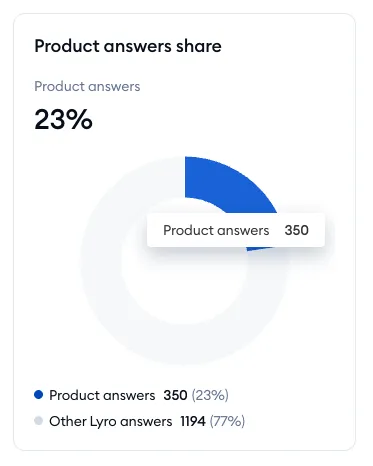
Product answers share
This graph shows a percentage share of Lyro's answers, comparing product-related answers to all other answers.
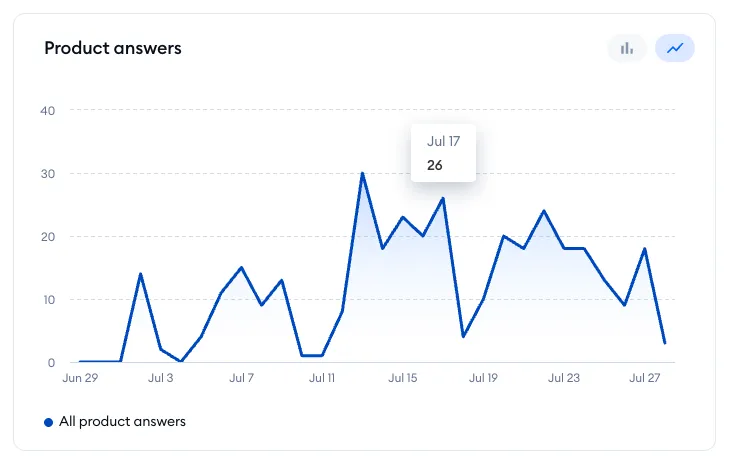
Product answers
This graph shows the number of all product-related answers over time.
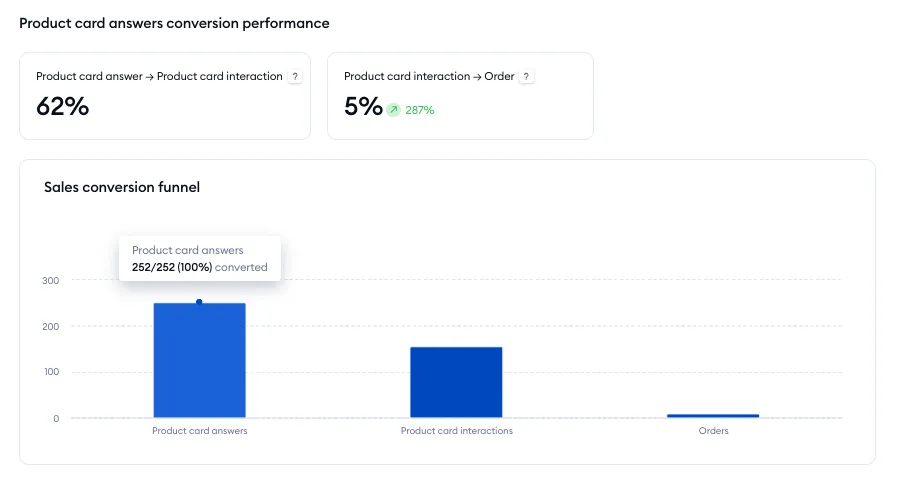
Further below, more metrics are available in the Product card answers conversion performance section:
Product card answer → Product card interaction
The percentage of product card answers that led to clicking on the product card or the Add to cart button.
Product card interaction → Order
The percentage of product card interactions that led to a paid order.
Sales conversion funnel
This graph, using both numbers and percentages, visualizes how visitors are converted from product card answers to product card interactions, and finally to orders.
Lastly, there is the Top recommended products list - showing Lyro's most relevant recommendations and their stats. The metrics include the following information:
- the product name
- the number of times Lyro has recommended the product
- the number of product card interactions
- the revenue from paid orders that followed a recommendation
- the number of paid orders

Sales metrics for flows
Inside the Flows tab you will find several metrics on sales related to flows.
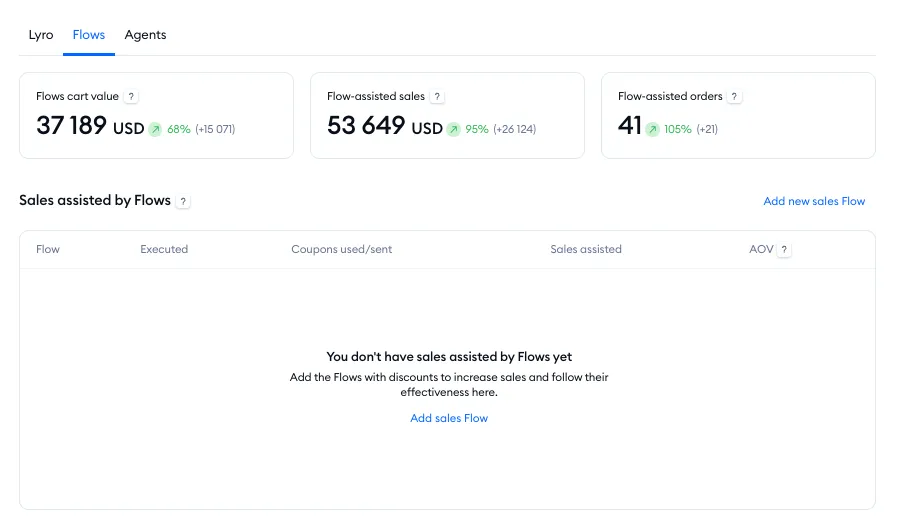
First, three metrics are shown at the top:
Flows cart value
The value of products that visitors added to their carts after interacting with a flow product recommendation or coupon.
Flow-assisted sales
The value of paid orders that customers purchased after interacting with a flow product recommendation or coupon.
Flow-assisted orders
The number of paid orders that customers purchased after interacting with a flow product recommendation or coupon.
Below that, you can see the Sales assisted by Flows list - showing the performance of flows that send coupon codes to visitors. The metrics include the following information:
- the flow name
- the number of flow executions
- the number of coupons sent
- the total value of all related sales
- the average order value

Sales metrics for agents
Inside the Agents tab you will find metrics on agent-assisted sales. Note that a sale is attributed to an agent if it was made within seven days since the visitor spoke to the agent (if a purchase is made later than that, it is not counted as a sale).
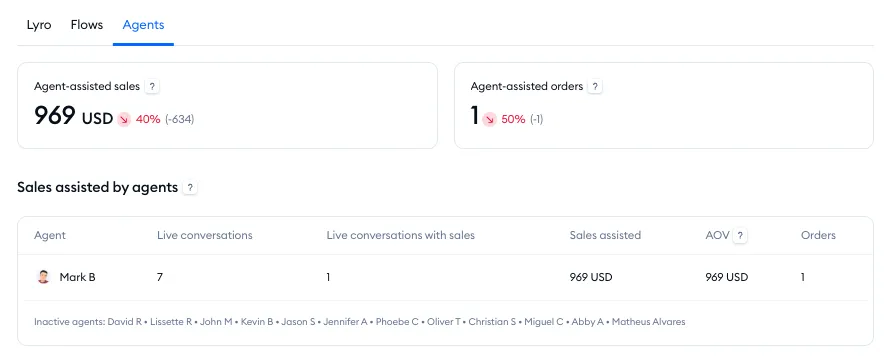
At the top, you can see two metrics:
Agent-assisted sales
The total value of paid orders that customers purchased after chatting with an agent.
Agent-assisted orders
The number of paid orders that customers purchased after chatting with an agent.
Below that, you can see the Sales assisted by agents list. The metrics include the following information:
- the agent's name
- the number of live conversations they've had
- the number of conversations that led to sales
- the value of all assisted sales
- the average order value
- the number of orders assisted

Sales (for non-Shopify projects)
The Sales section lets you see some useful product-related data.
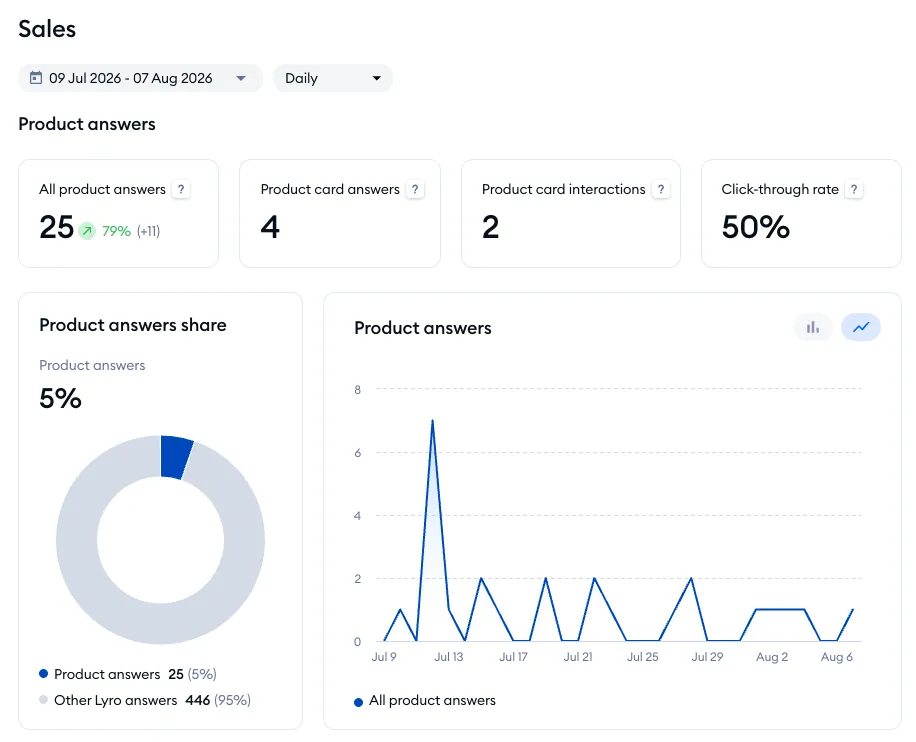
You can select a specific date or timeframe that you're interested in by using the calendar menu in the top-left of the Sales section. At the top of this section, you will also see four metrics:
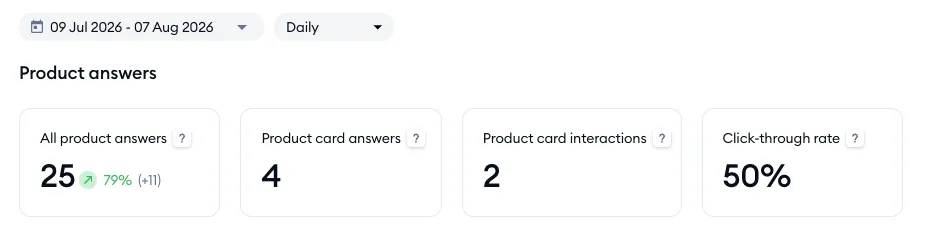
All product answers
The number of Lyro responses to product-related questions, using knowledge from your product database.
Product card answers
The number of Lyro responses that included product cards.
Product card interactions
The number of clicks on product cards, including card clicks as well as Add to cart button clicks.
Click-through rate
The percentage of product answers that led to clicking on a product card or the Add to cart button.
Below that, there are two additional graphs:
Product answers share
This graph shows a percentage share of Lyro's answers, comparing product-related answers to all other answers.
Product answers
This graph shows the number of all product-related answers over time.
Lastly, there is the Top recommended products list - showing Lyro's most relevant recommendations and their stats. The metrics include the following information:
- the product name
- the number of times Lyro has recommended the product
- the number of product card interactions
- the revenue from paid orders that followed a recommendation
- the number of paid orders