At Tidio, we strongly believe in the data since it is key to understanding your users. We listened to you carefully and learned that one of the highly requested features was a tool to understand better how your flows are performing.
In this article, you'll learn:
- Where to check the performance of the flows
- How to see how visitors move through each step of a flow
- How to increase engagement with flows
- How to make flows more interactive
- What is the monthly flow limit
Performance of my Flows
To see how your flow is performing - head over to the Flows section of Tidio (on the left-side menu in your Tidio admin panel).
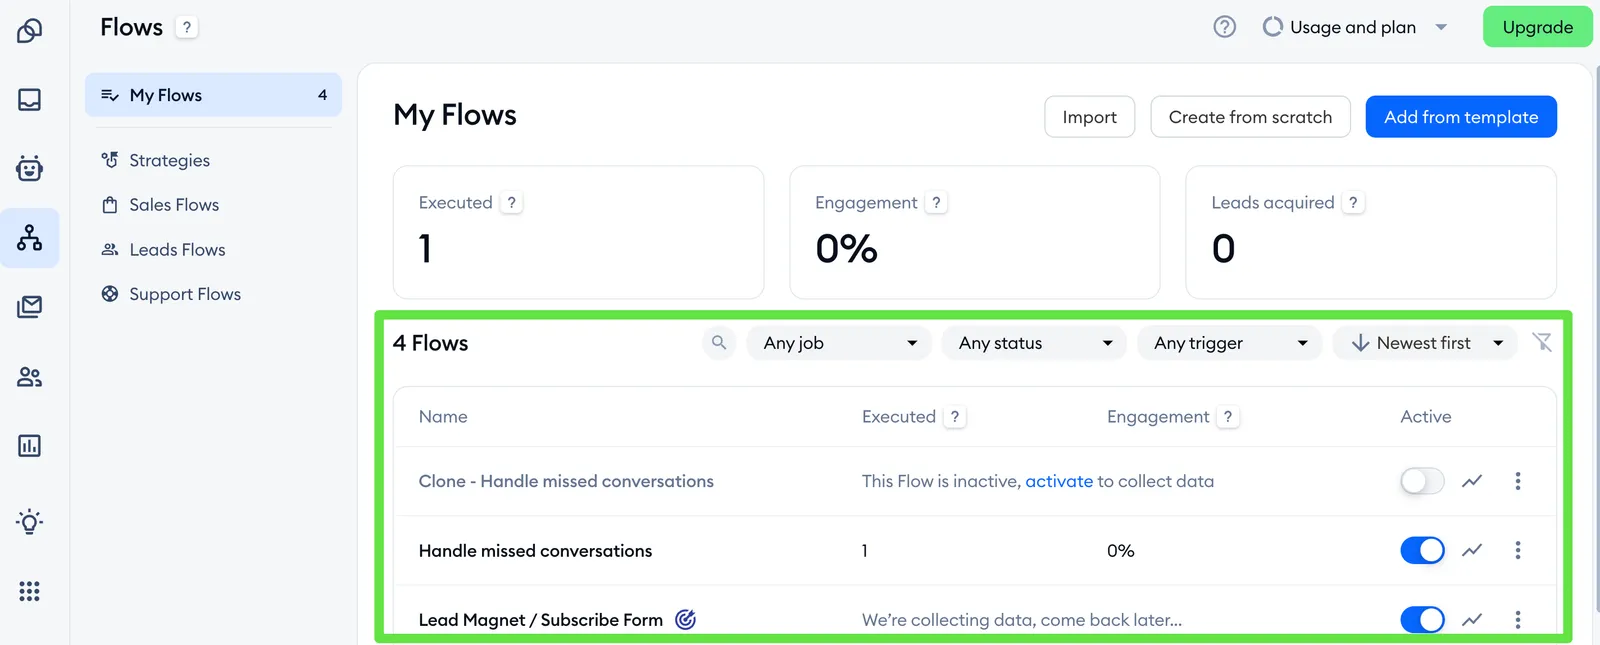
On the left side, you will see the flow's name, and on the right - whether the flow is active or inactive, three dots menu with an option to edit it, test it out or see more options. On the top, you will see the analytics of all your flows for the last 30 days.
In the Tidio Flows section, four metrics are available:
- Executed - shows a number of times when the flow was executed in the last 30 days.
- Engagement - shows what percentage of visitors interacted with a flow in the last 30 days.
- Helpfulness - shows how visitors rated the flow's messages (thumbs up or down), for messages where you ask for feedback.
- Handoff - shows how often visitors left the flow by typing a message instead of using its buttons. It's available for support flows only.
You'll see Executed and Engagement next to each flow in the list. Click on the flow's name to open its statistics window, with the Executed, Helpfulness, Conversations and Handoff tabs. Learn more in Flow Metrics and The Handoff Metric.
Analyzing each step of a flow
Want to know where visitors drop off? Open the flow in the editor, and switch from Edit to Analyze (or click on Analyze nodes in the flow's statistics window). Each step will show the share of visitors who reached it - hover over the number to see, for example, "120 of 400 unique visits" in the selected dates:
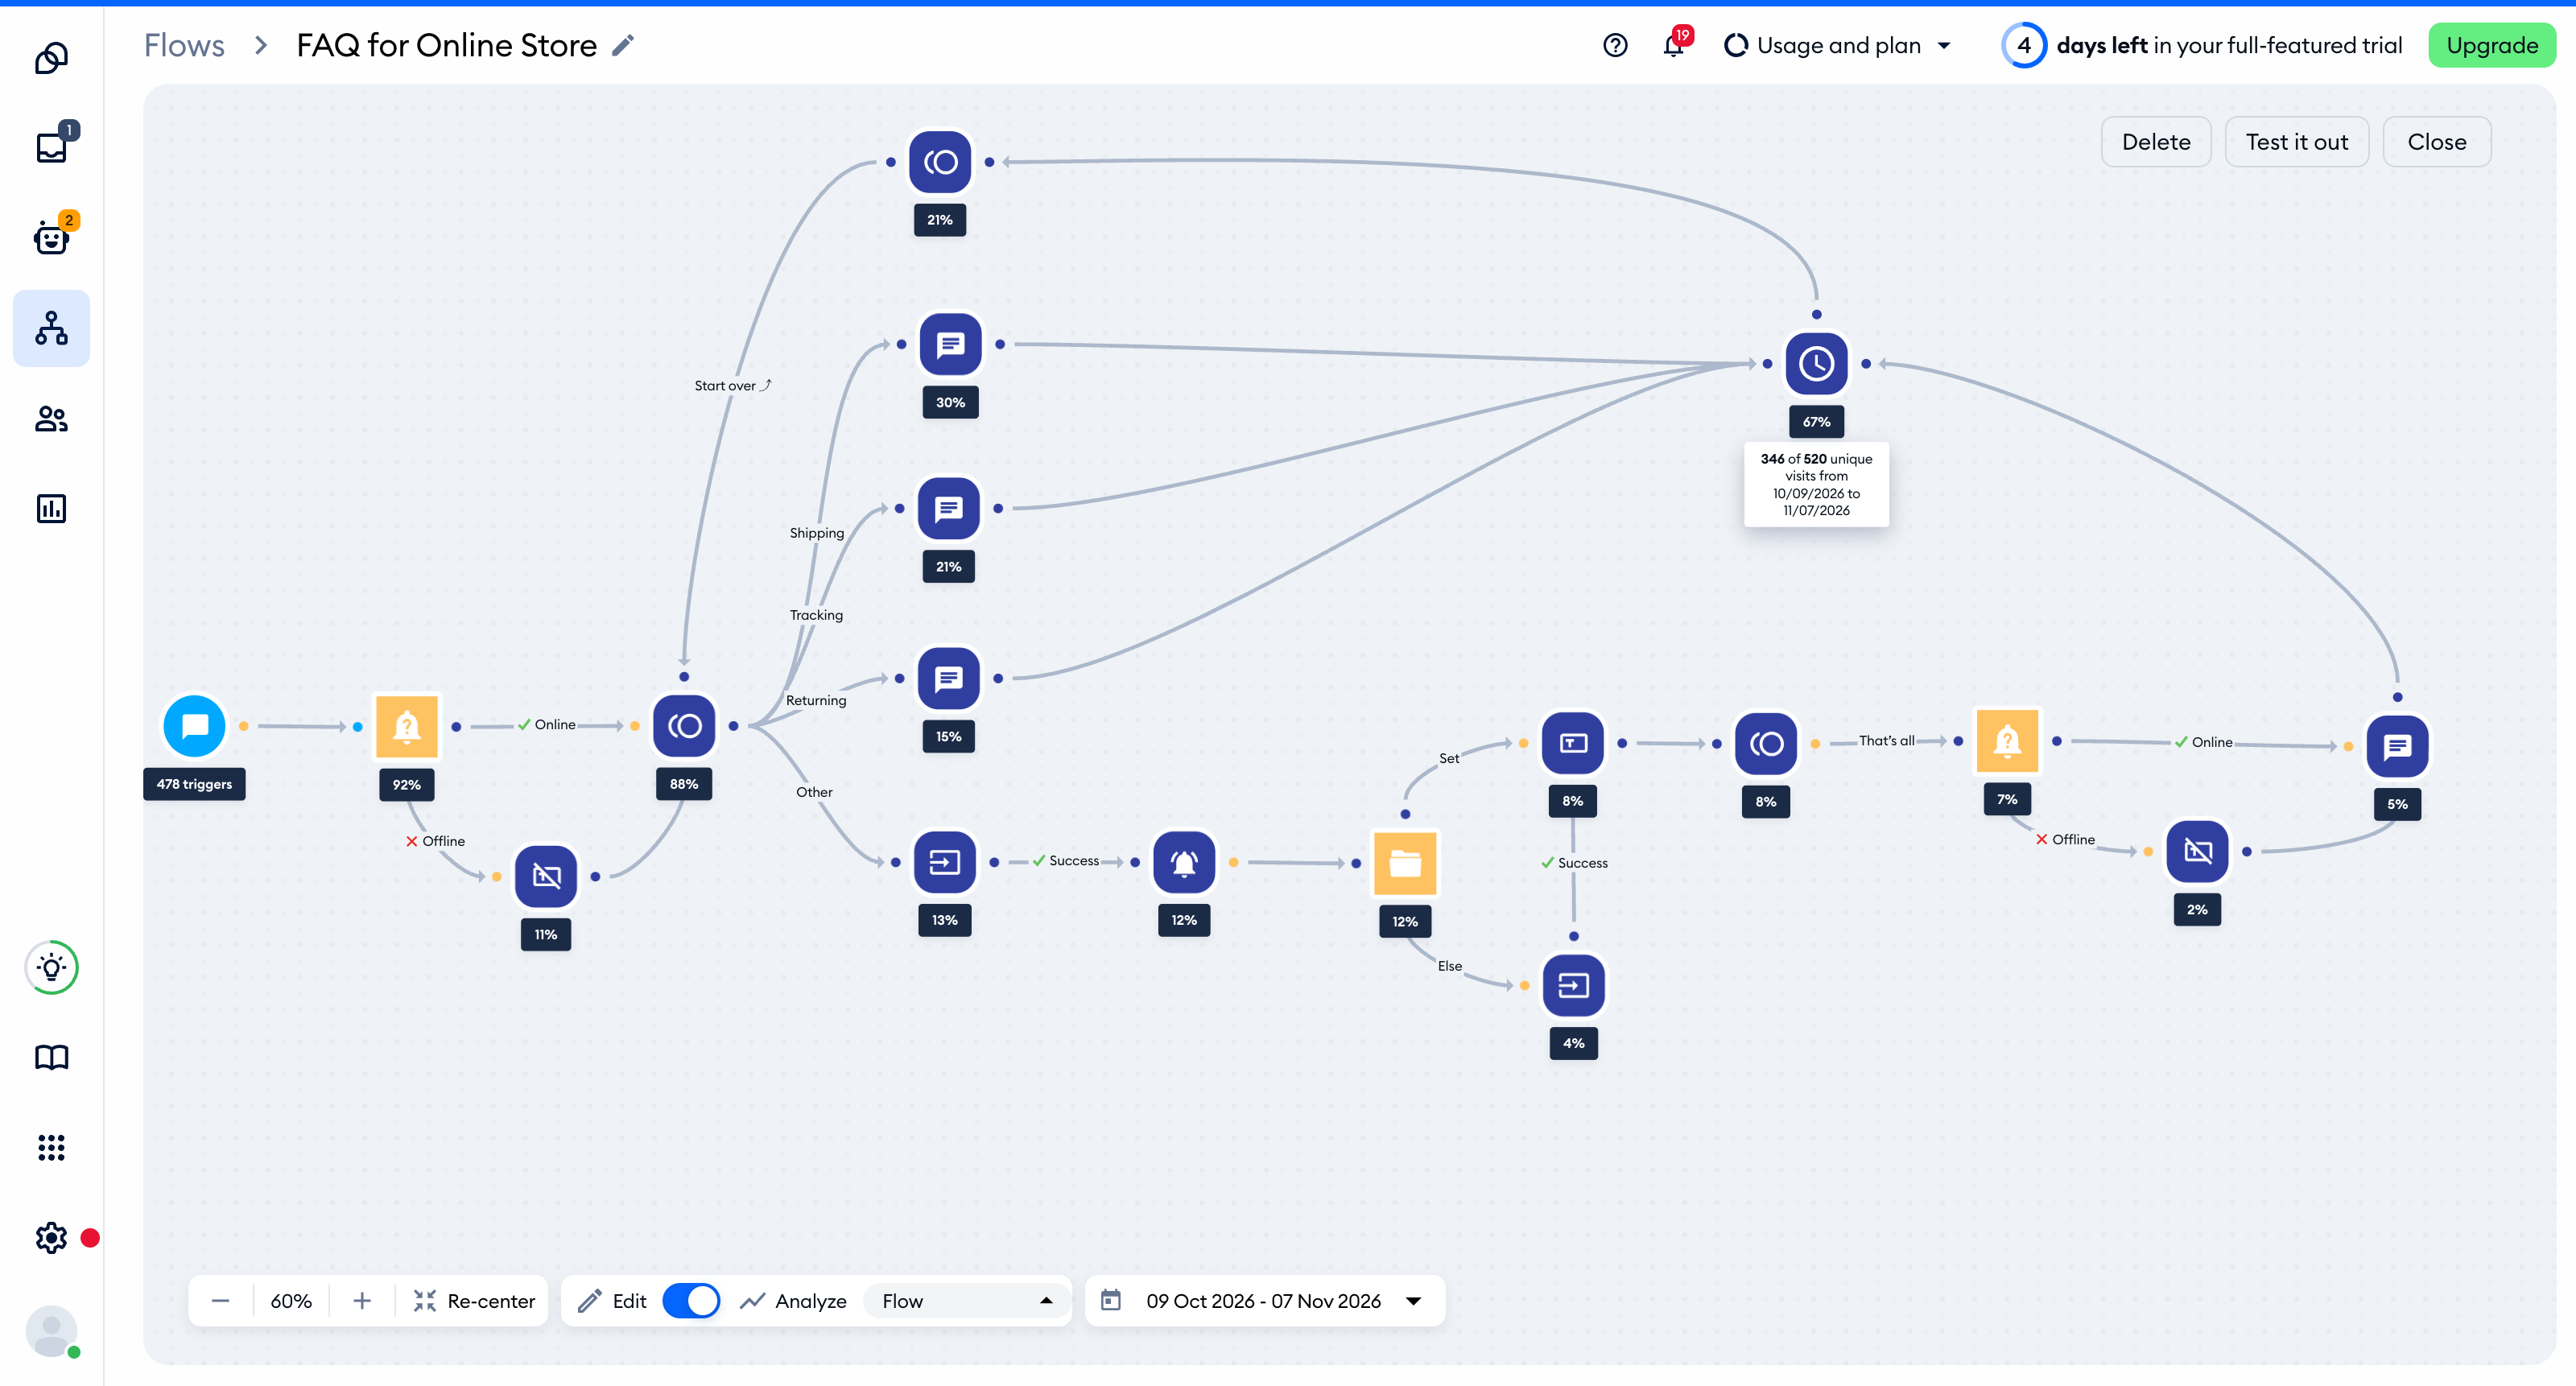
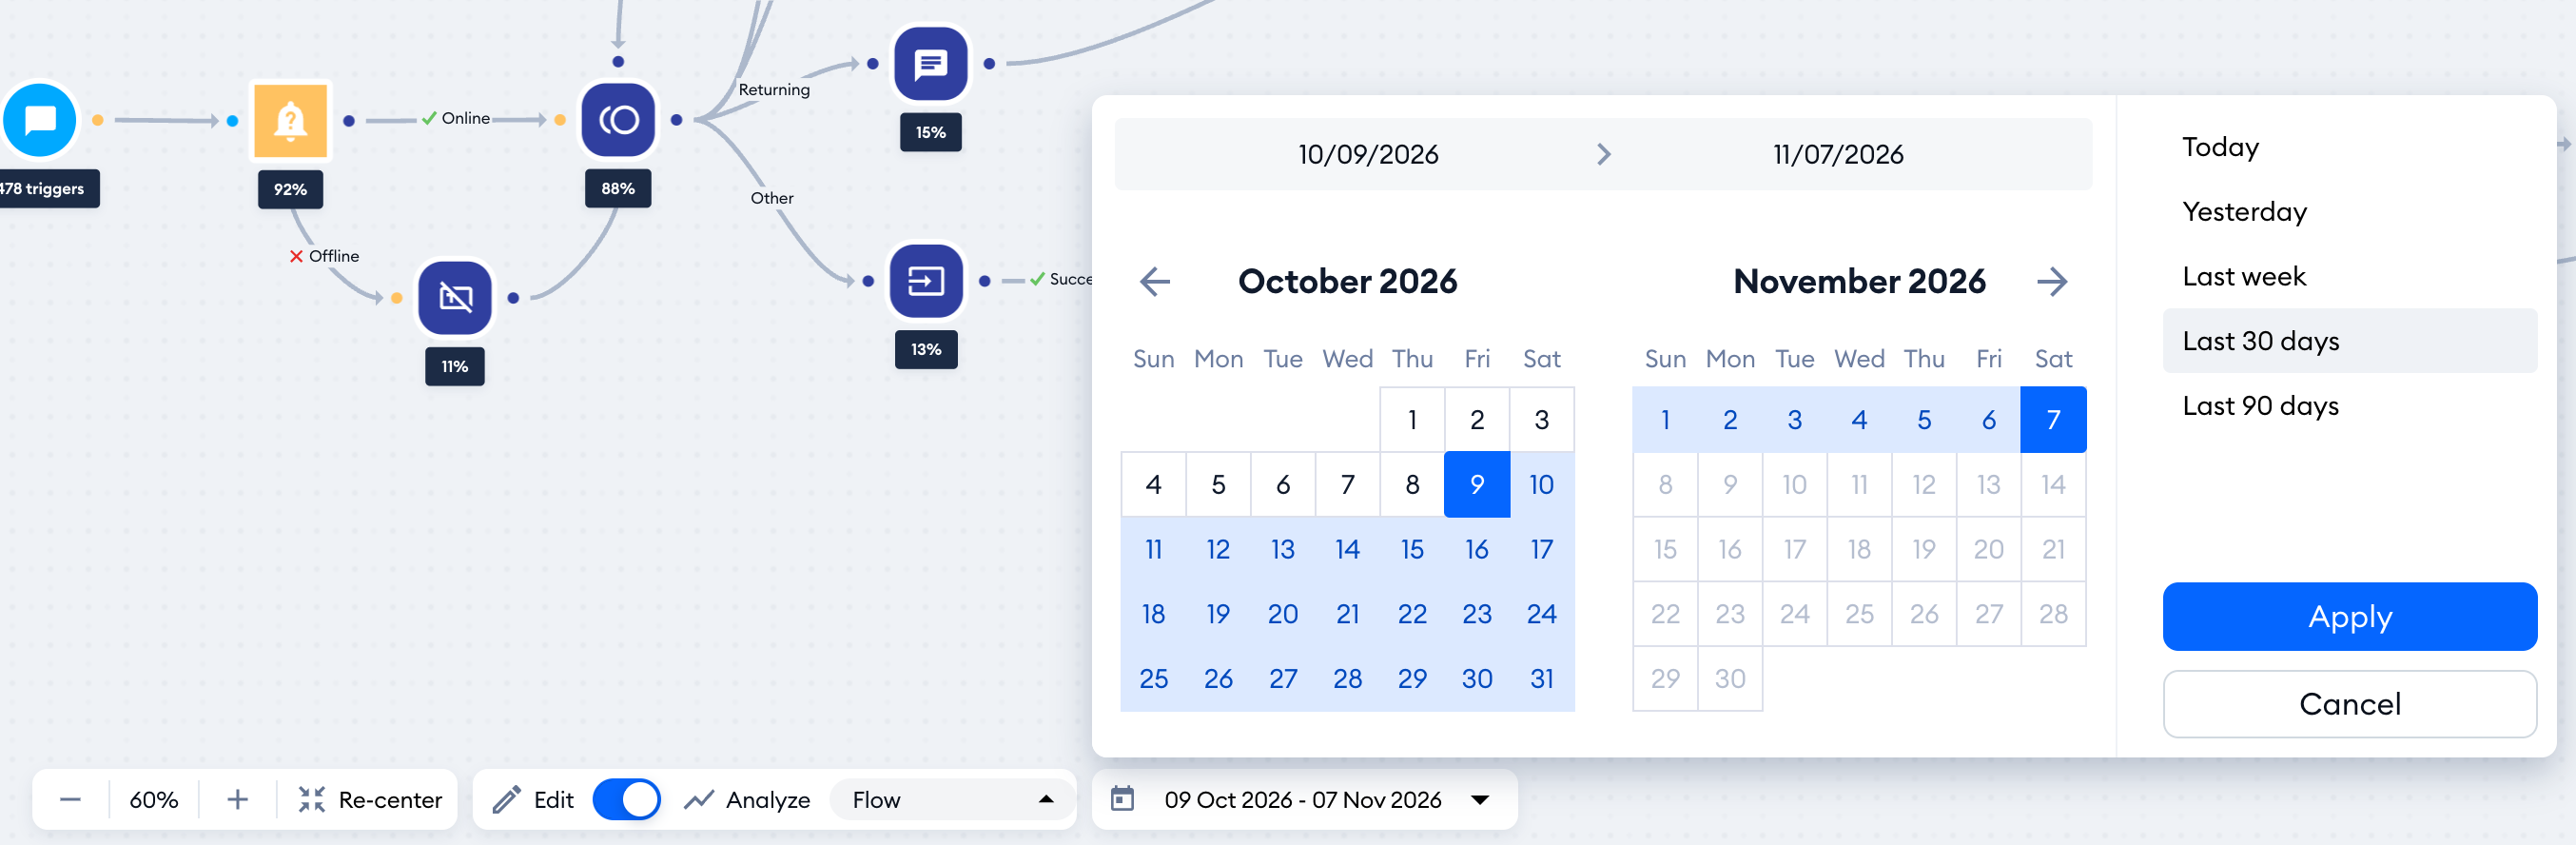
By default, Analyze mode shows the Last 30 days. Use the date range next to the switch to pick Today, Yesterday, Last week, Last 30 days, Last 90 days or your own dates, up to 90 days back:
For support flows, you can also switch the list next to Analyze from Flow to Handoff, to see the steps where visitors left the flow (see The Handoff Metric).
Please note: step statistics start again each time you change the flow, so you can't pick dates from before your last change. Until there's enough data, the switch is greyed out with the tooltip We'll show you the analytics as soon as we collect enough data. If you're viewing a draft, Analyze mode reminds you that changes may affect the flow's analytics.
Increase engagement with flows
A short welcome for customers can make their shopping experience a little more pleasant. It is also one of the key factors for increasing your sales. However, please note that if you don't require any action from the visitor, it will not increase your engagement metric.
A flow's greeting message might be the very first interaction a person's received from the brand. With a flow, your website visitors will see the message almost right after landing on the site. Whatever you say will make the first impression about you and your brand's personality. If you truly want to engage your users, ask questions and provide them with buttons, cards, or quick replies.
Also, take a look and learn how to edit the flow and its initial message.
Make flows more interactive
- Don't create different flows with the same trigger (e.g. it's better to have one multi-language flow rather than two or more flows with the same trigger). If you activate a few flows with the same trigger, the flows starting with these triggers will be triggered simultaneously, which may cause several messages to be sent to a visitor.
- Be careful with delays. If you set a long delay after the trigger, your delayed flow may possibly affect the triggering of other flows in the meantime.
- Ask for an email in return of the coupon codes (e.g., it's better to give vouchers to users that you asked for the email addresses first, rather than sending it to everyone with their first visit on the website)
- Update your non-interactive flows with nodes that interact with visitors (Use the following actions that require interaction from your website visitors: Ask a question, Decision Cards, Decision Buttons, Quick Replies)
The monthly flows limit
The Flows package allows you to reach a certain number customers with automated messages sent by your flows. We call this the monthly flows limit or the flows quota.
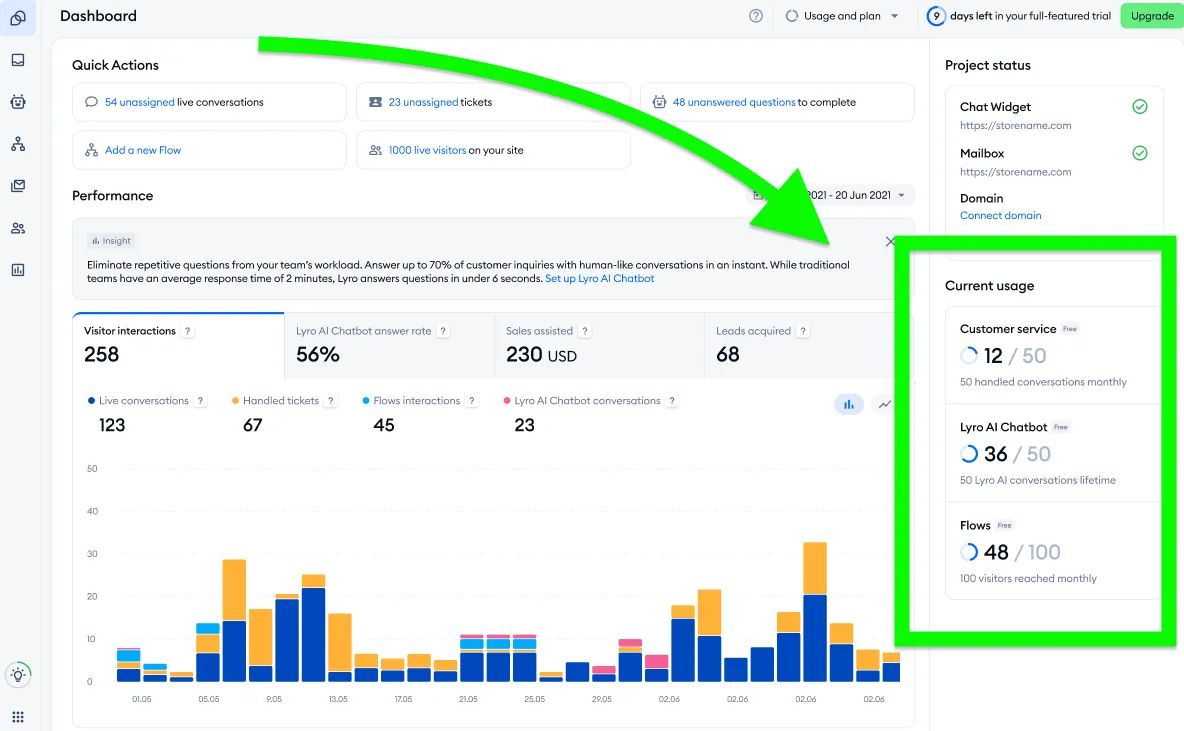
You can track your current flows quota (as well as other quotas of your project) in the Dashboard section:
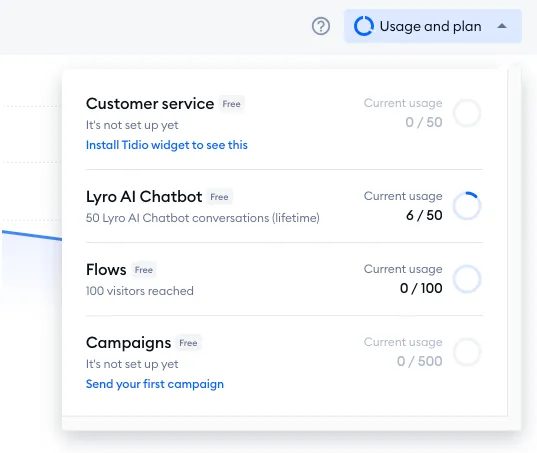
You can also check the basic quotas quickly by clicking on the Usage and plan button in the top-right:
How is the flow usage calculated?
🤖 1 unique visitor = unlimited flows executions
One unique visitor who has executed at least one flow consumes 1 from your monthly quota. The same same visitor can execute more flows, or even the same flow multiple times, and this will not consume your monthly quota anymore. It's a bit like an "all you can eat" offer in some restaurants; pay once, and consume all you like.
You can send multiple flow messages (e.g. a welcome message to new visitors, discounts for returning visitors, auto-replies for missed chats, etc.) to one unique visitor, and it would still be counted as just one visitor reached. It basically means that you can provide each visitor with unlimited flows during your monthly limit cycle.
In the free version, the number of visitors reached is limited to 100 per month. That means your flows can serve a maximum of 100 unique visitors per month.
So don't worry if one of your flows does not perform well. Experiment with optimizing it. You can also try engaging visitors on different user journey steps.