The Dashboard is the first thing you normally see when you log in, and for good reason. It serves as a kind of command center, where you can quickly access the most important aspects of your current project - navigate to key areas, keep track of your quotas, and check your performance stats. All this lets you control the state of your Tidio project and how it's used to help your business. You also get recommendations for further improvements, as well as the latest Tidio news and articles worth reading.
You can access the Dashboard from the very top-left of your Tidio panel:
In this article, you will learn:
- How to navigate the Dashboard
- What Quick actions are
- What the Performance graphs can tell you
- How to check your project status and quota usage
- What the News Feed is
The Dashboard - an overview
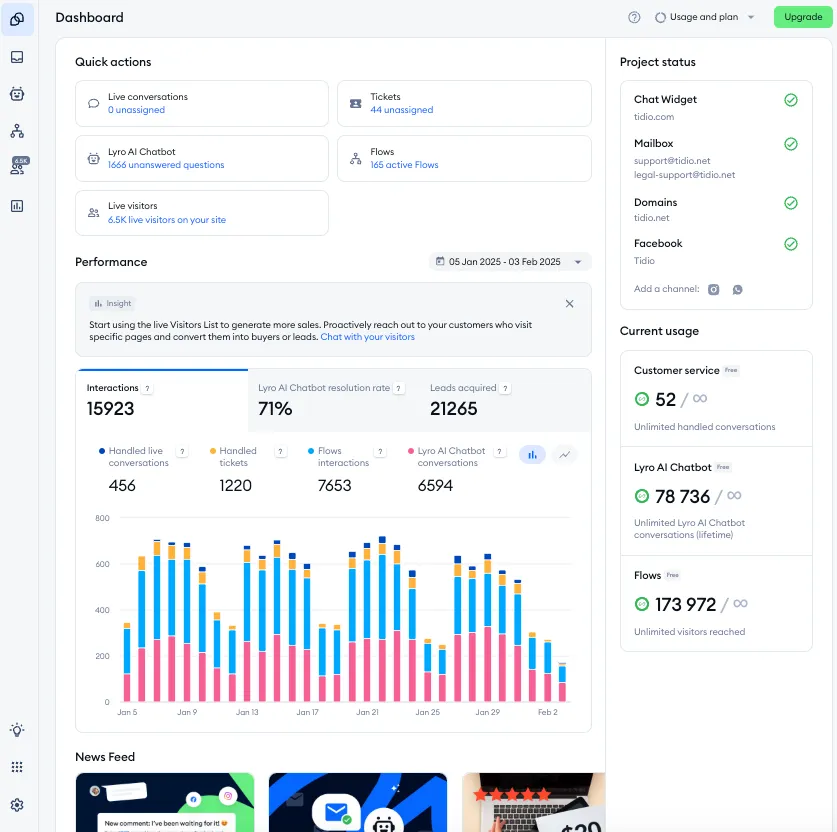
The Dashboard is designed to help find everything you need in one place, with a clean, simple design. You will find the Quick actions at the top; the various Performance statistics (and insights) underneath; your Project status and Current usage on the right; and the News Feed at the very bottom.
Quick actions
Located at the top of your Dashboard, Quick actions let you navigate to key areas - so you can stay on top of your priorities with minimal browsing.
Here you can view your unassigned conversations and unassigned tickets, address unanswered Lyro questions, monitor your active flows, and see your website's live visitors - all from a single section:

Click on any of the links to go straight to the right place. If Lyro isn't switched on yet, its card says Set up Lyro AI Agent instead; if you don't have any Flows, the Flows card offers Add a new Flow.
Performance (and smart insights)
Located right underneath Quick Actions (and making up the majority of the entire Dashboard), the Performance section gives you useful, practical information about different aspects of your project. At the top, you can use the calendar menu to select a specific timeframe you'd like to analyze, as well as see smart insights tailored to your project (e.g. recommendations on further actions you can take to improve your performance).
Below the insights you can see your general project statistics, displayed according to the range of dates you've selected in the upper-right. The particular stats are visualized in the form of charts, each in its own labelled tab. The available charts are as follows:
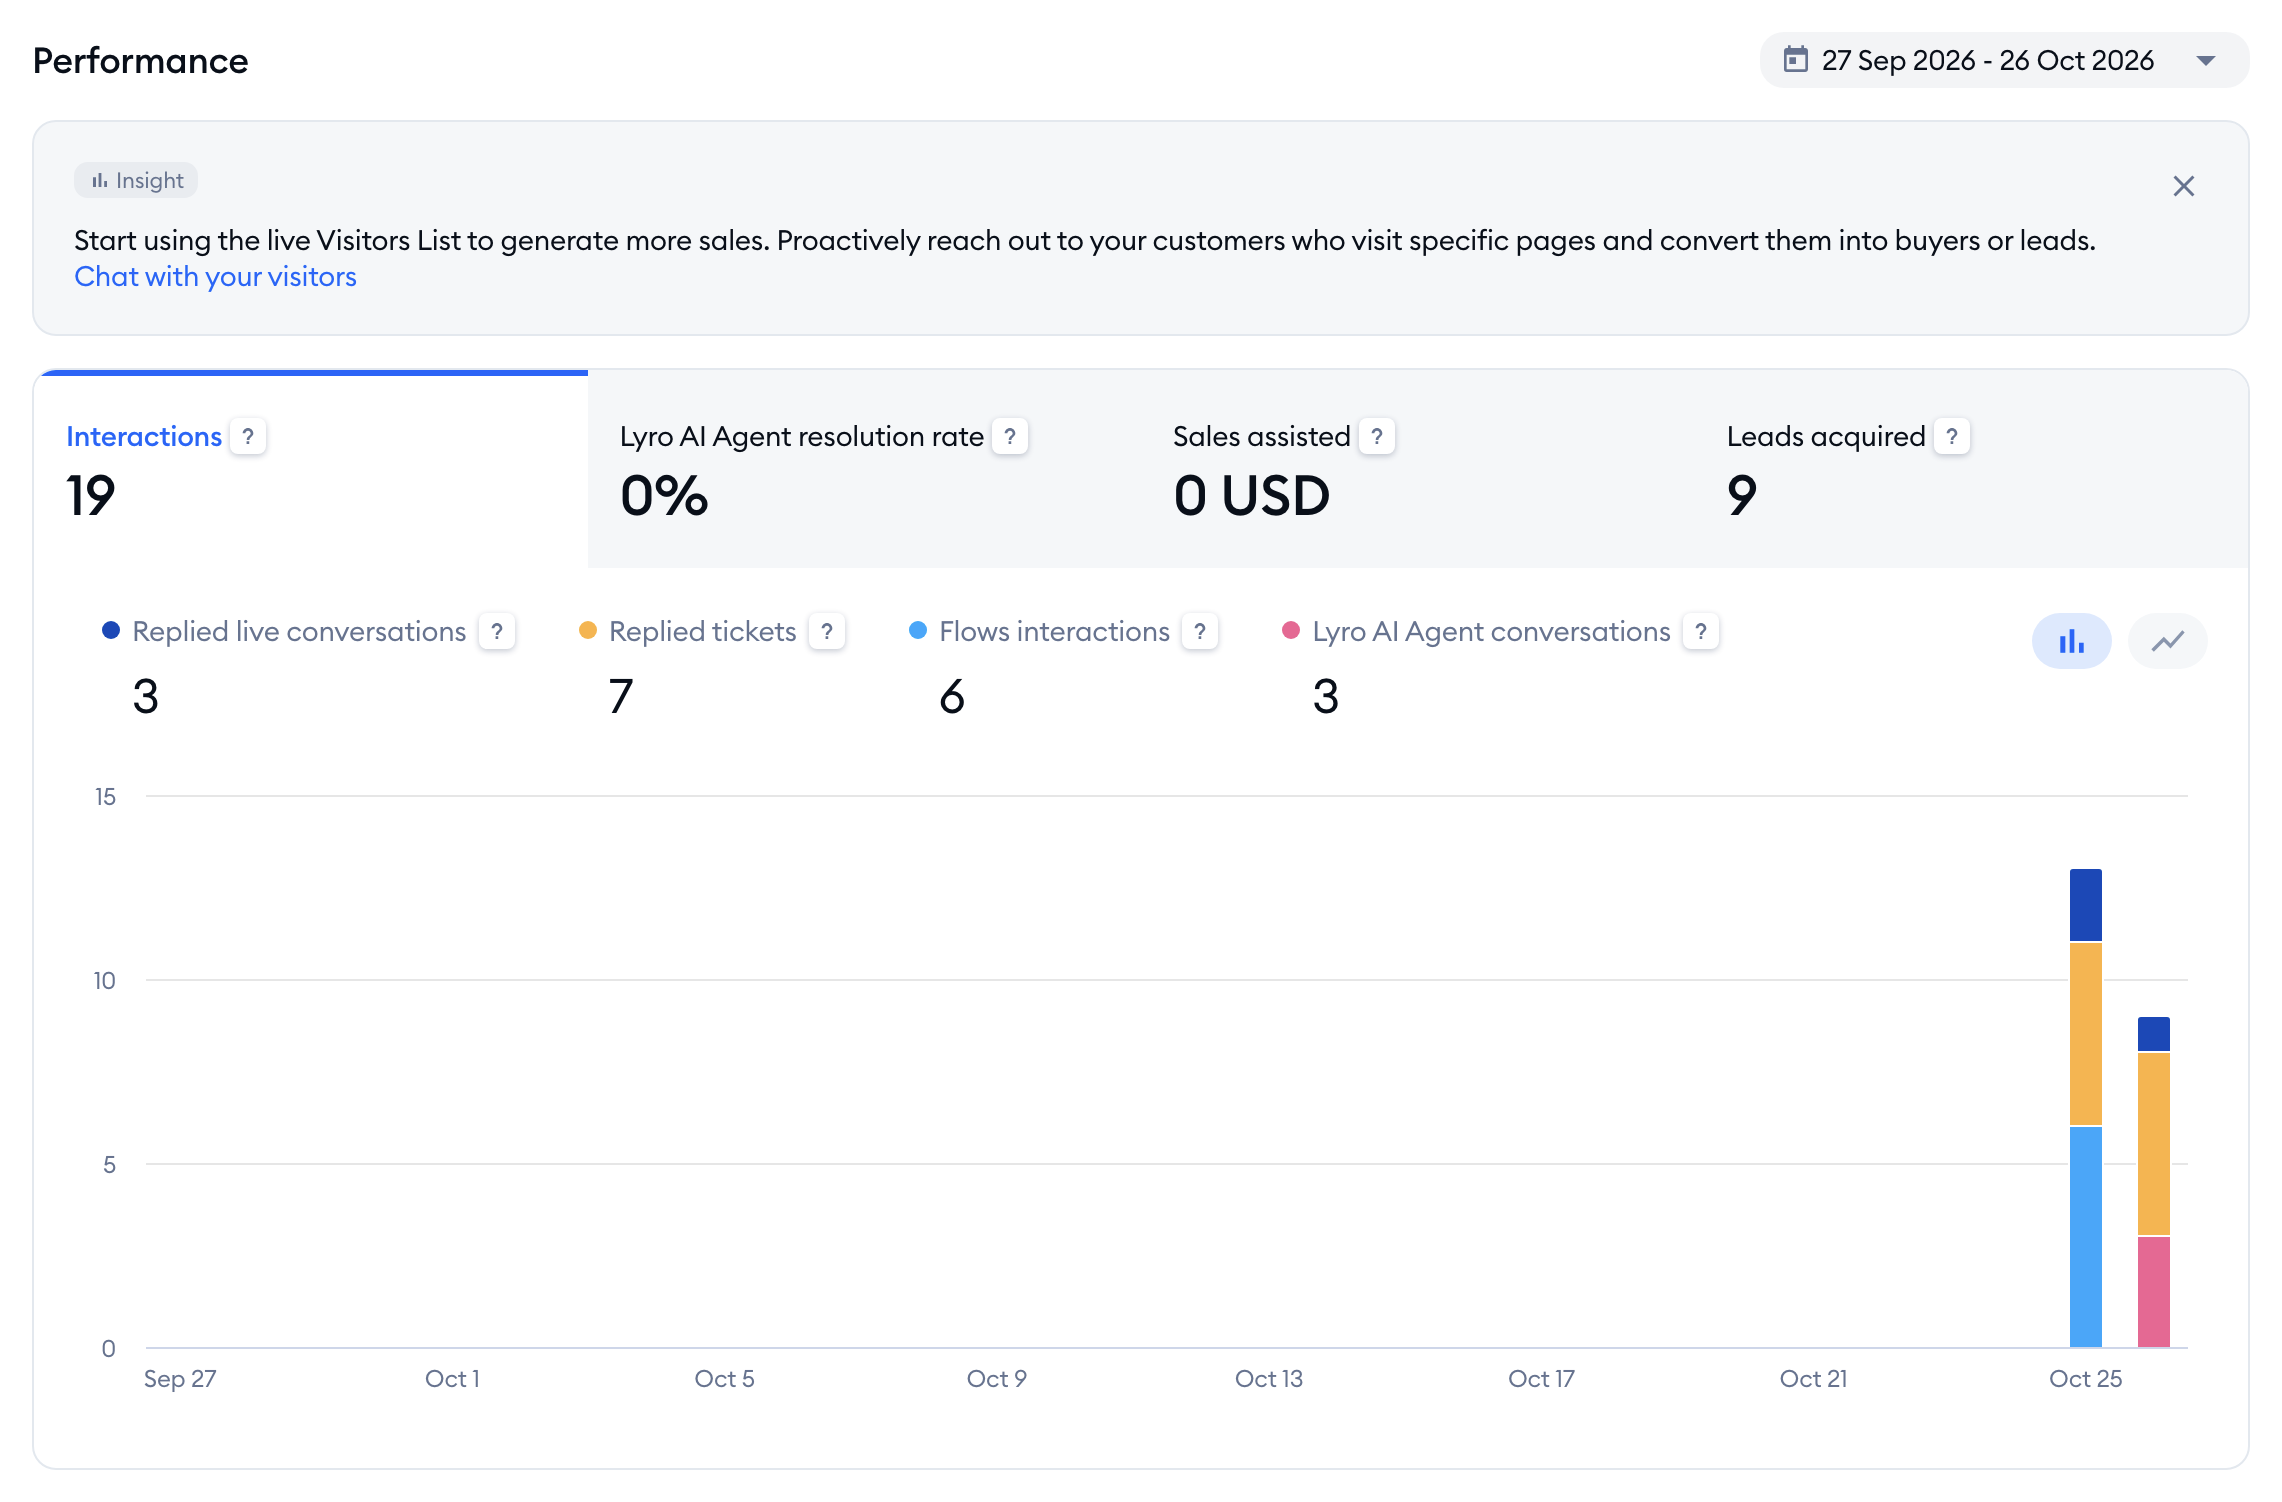
The Performance charts show the Last 30 days by default, and you can go up to 90 days back. These are the same charts as in Analytics > Overview (see The Analytics section), and they're available on every plan. The Sales assisted and Leads acquired tabs are shown to agents whose role can see sales and leads analytics.
Note that you can switch between two different chart modes in the upper-right of each tab: bar chart and line chart:
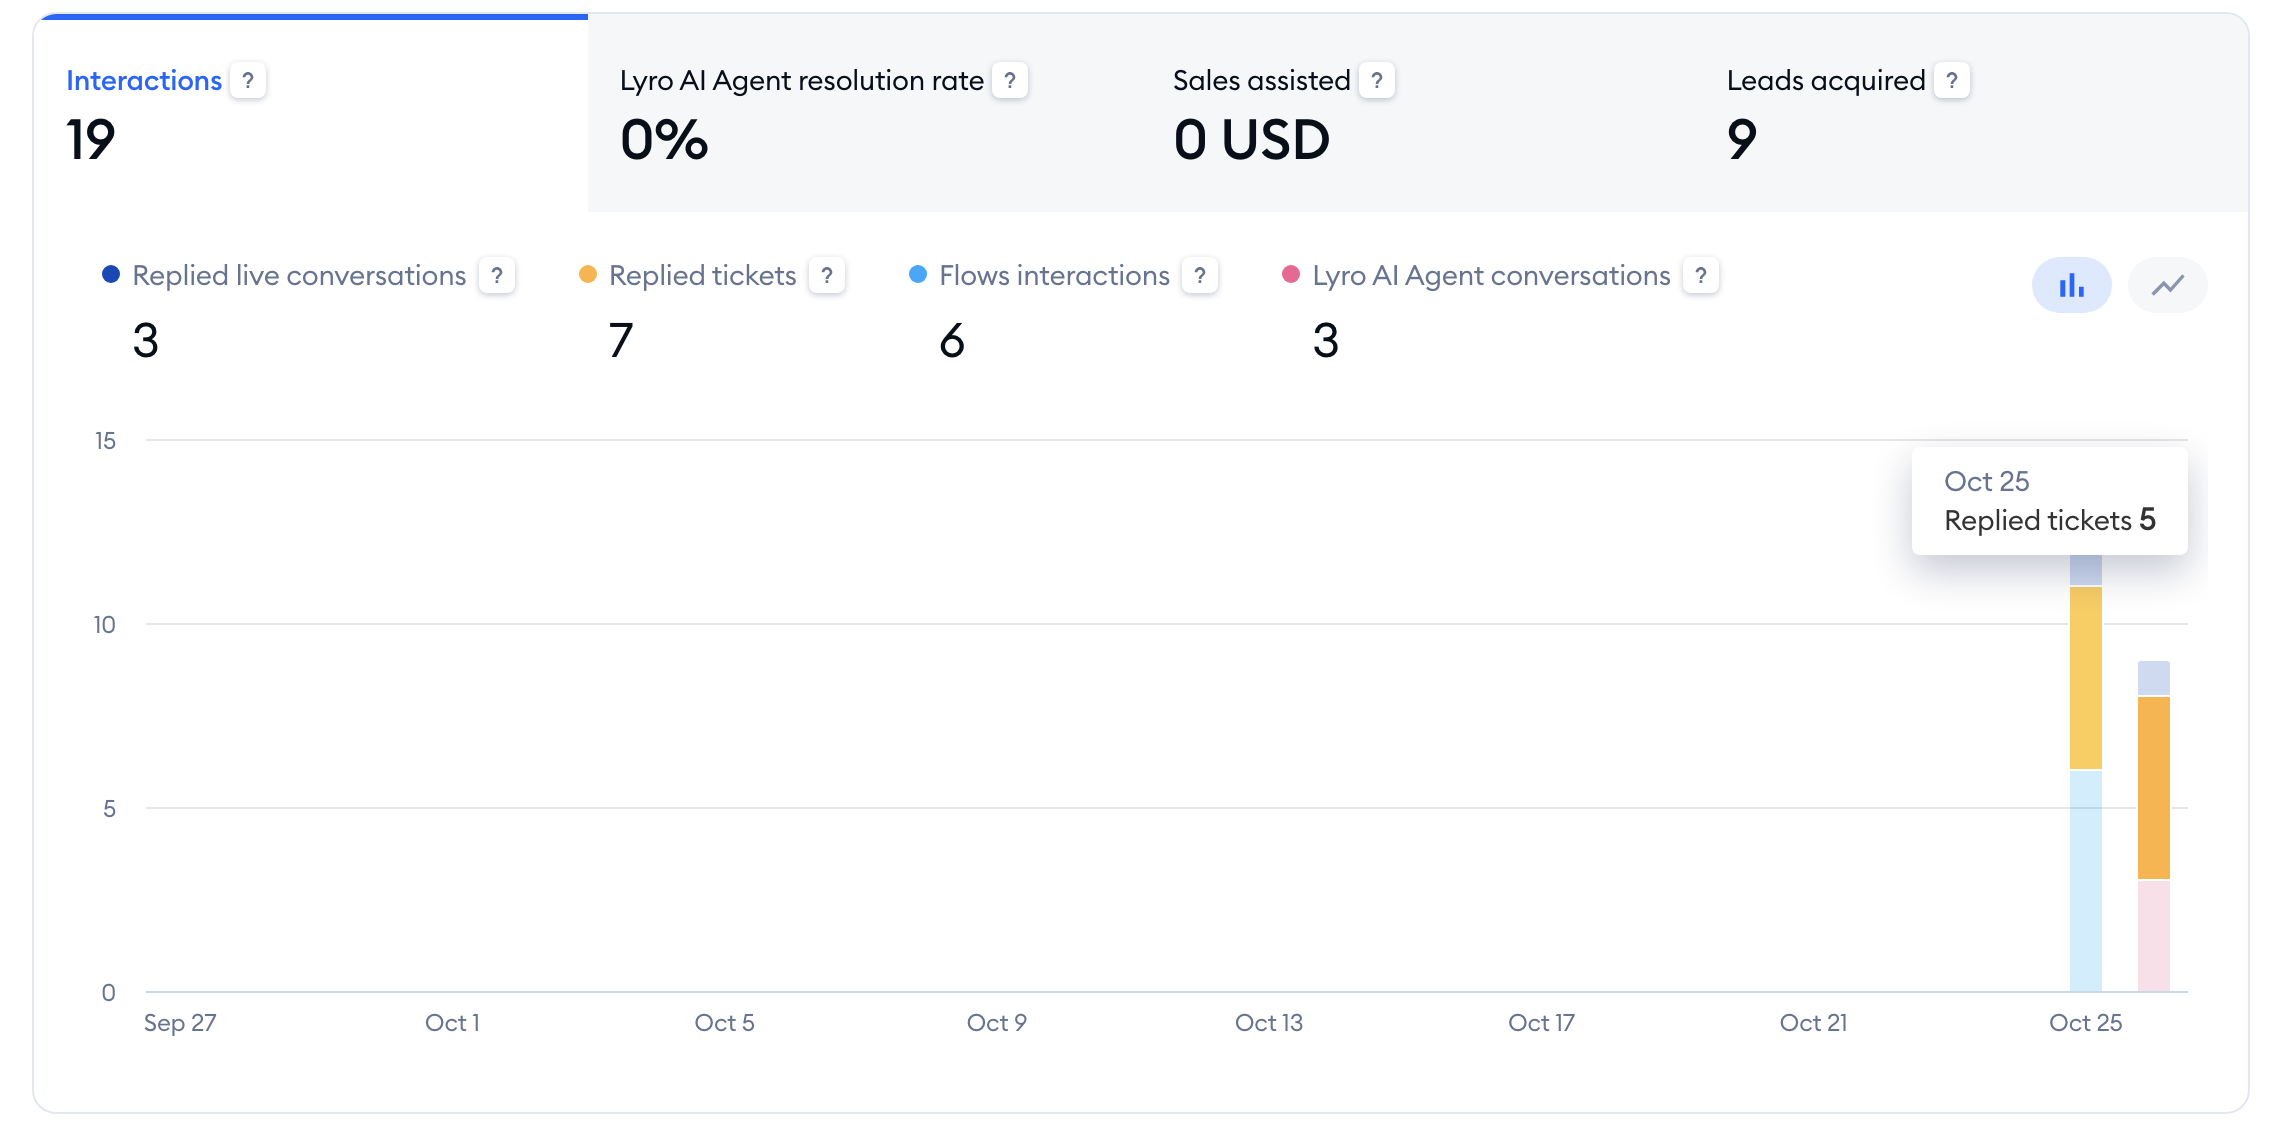
Interactions
This chart shows all of your project's interactions between your widget and the visitors so far:
- Replied live conversations - how many chats your agents have had
- Replied tickets - how many tickets your agents have responded in
- Flows interactions - how many times visitors have used your flows
- Lyro AI Agent conversations - how many questions Lyro has answered
Hover your cursor over a specific bar (or point) on the chart to see more details.
Lyro AI Agent resolution rate
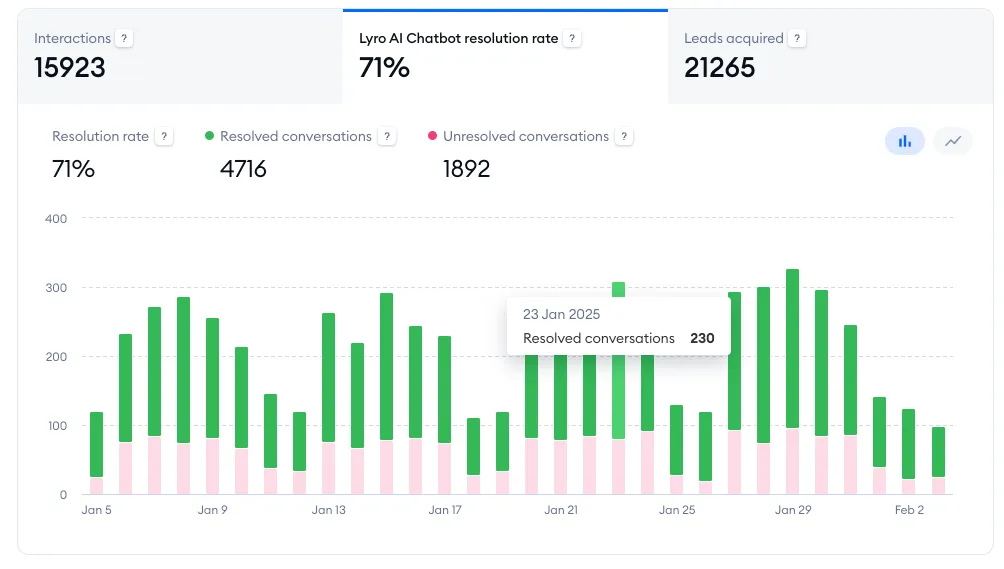
This chart depicts the rate at which Lyro has been able to answer your visitors' questions; it shows you the general rate percentage (how much Lyro was able to answer without any more questions or requests from the visitor), as well as the specific numbers of resolved and unresolved conversations.
Hover your cursor over a specific bar (or point) on the chart to see more details.
Leads acquired
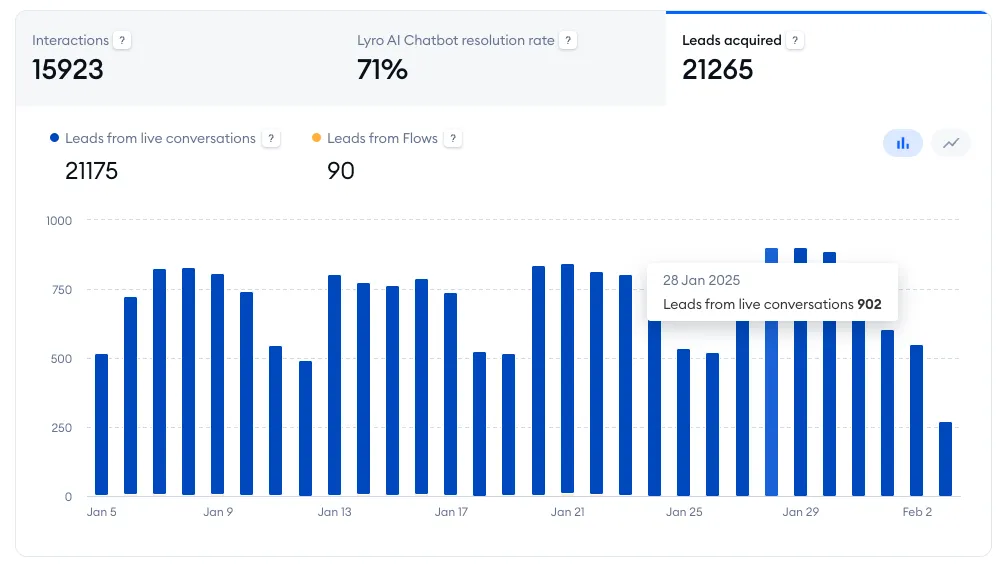
This chart visualizes the number of leads you've collected over time, resulting in contact information being saved in your project's Contacts list (found inside the Customers section). You can see the leads gathered via live conversations (this includes the Pre-Chat Survey, social media channels, and tickets) and those gathered by your flows.
Hover your cursor over a specific bar (or point) on the chart to see more details.
Sales assisted
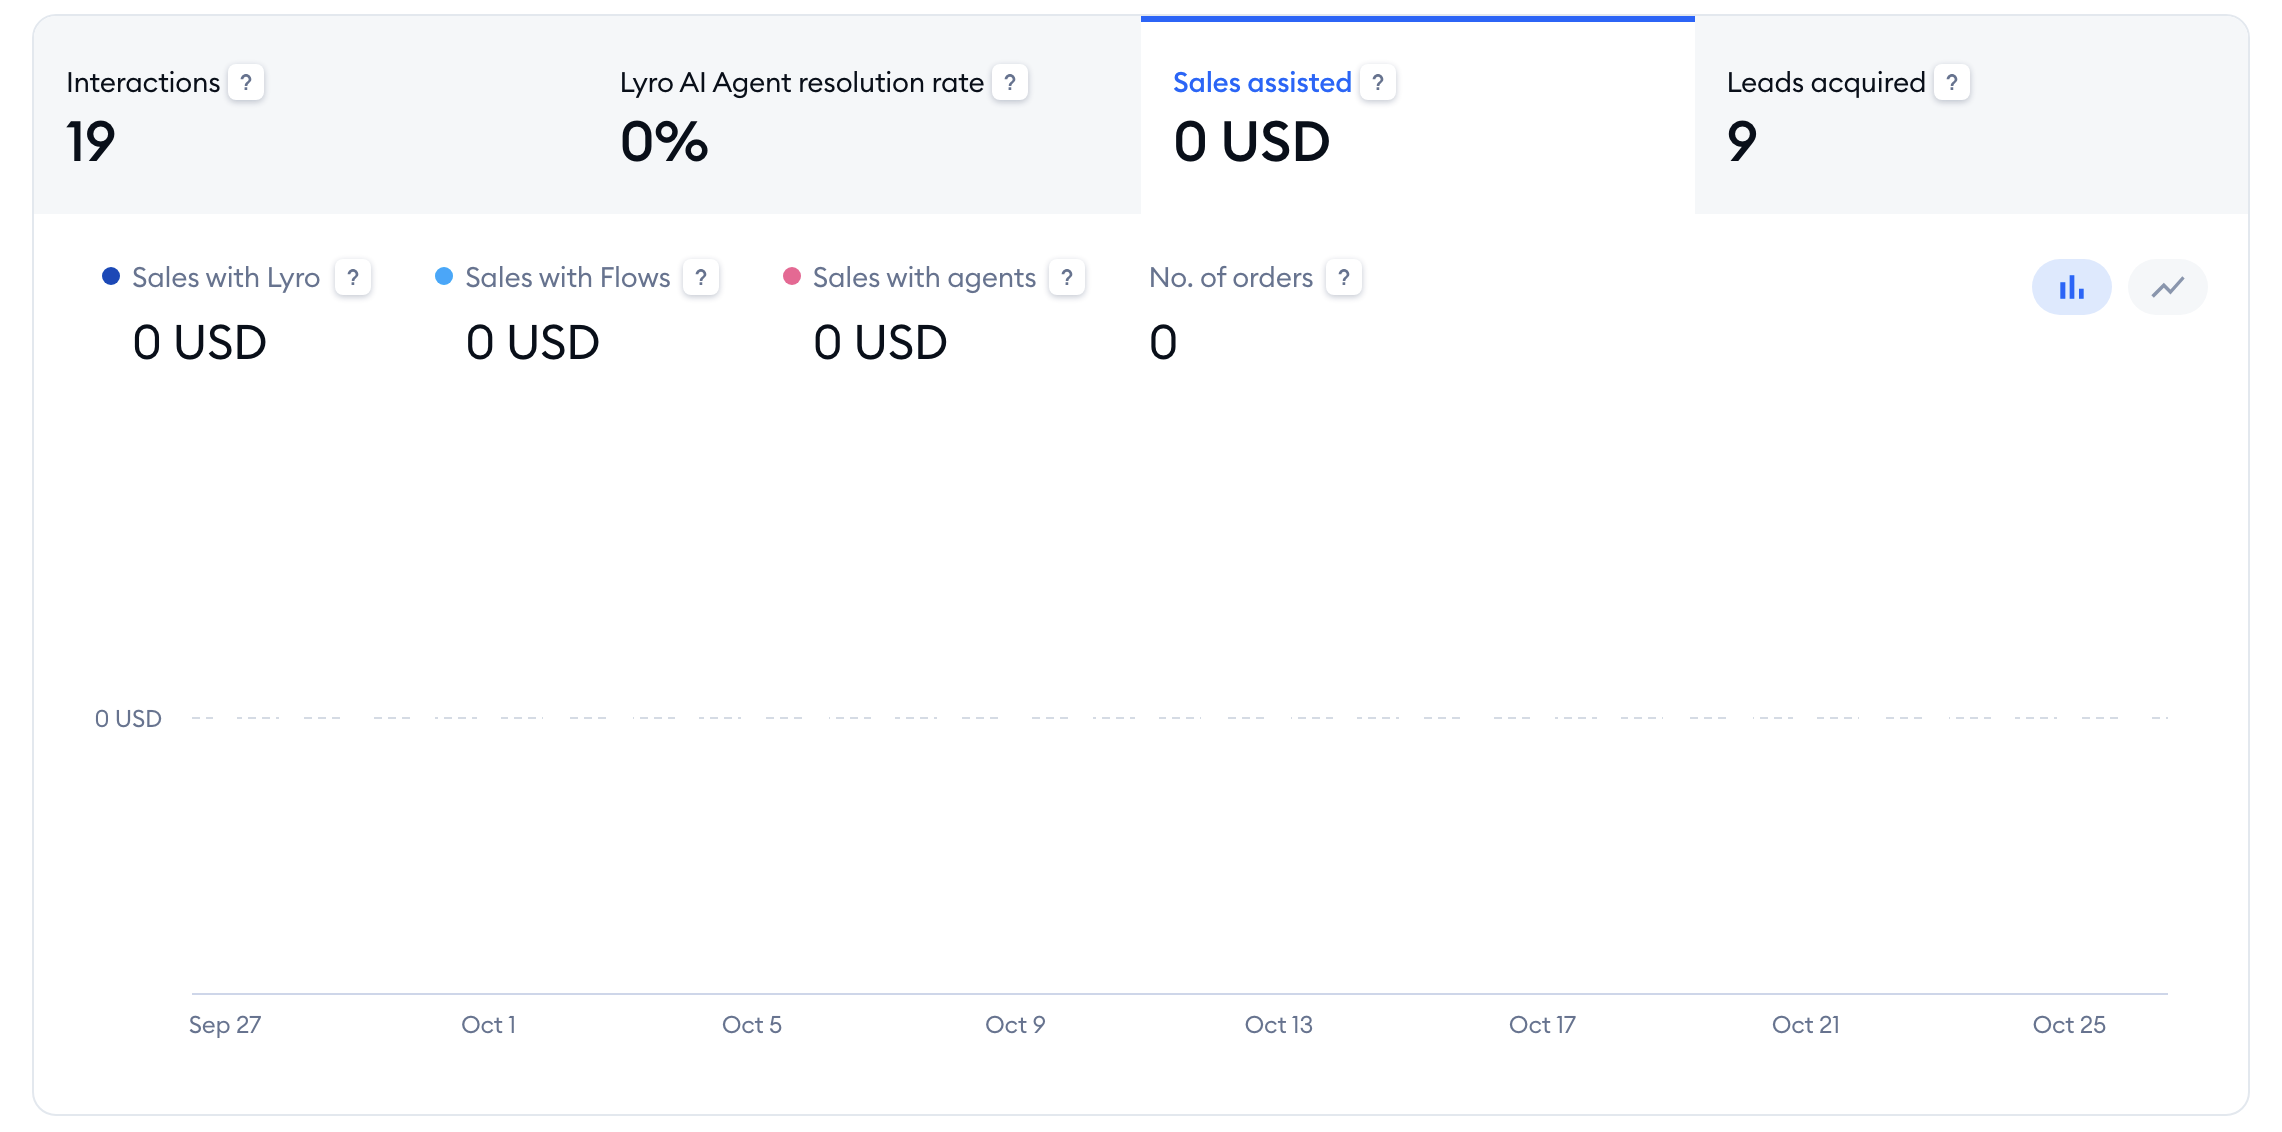
This tab depicts the sales revenue from all orders assisted by Tidio over time, shown separately as Sales with Lyro (orders after the shopper clicked on one of Lyro's product recommendations), Sales with Flows (orders after a product recommendation or a coupon in a Flow) and Sales with agents (orders placed within 7 days after a chat with an agent), together with the No. of orders.
The tab is there for every project, not only for Shopify stores. If you haven't had any assisted sales yet and you don't have a sales Flow, you'll see Increase your sales with Flows instead, with the Add sales Flow button that takes you to the sales Flow templates.
Hover your cursor over a specific bar (or point) on the chart to see more details.
Project status and quota usage
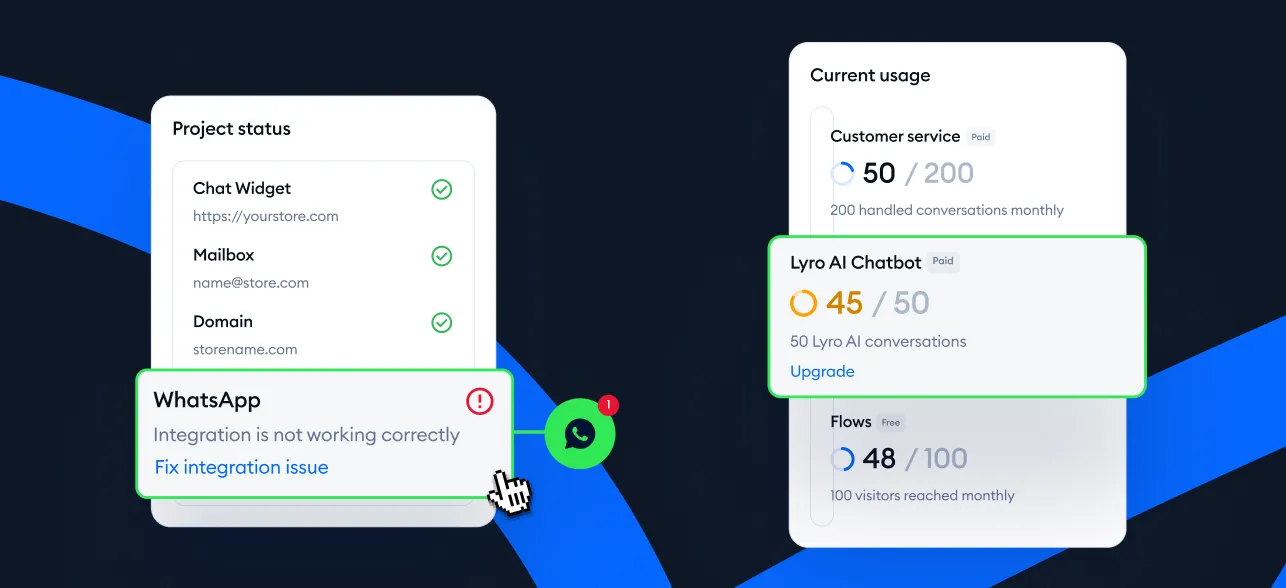
This section of the Dashboard is located on the right, in a column. It consists of two parts: Project status and Current usage. These will help you monitor the current state of your installation, integration, and general project usage.
Project status
Here you can see basic info about your installation, mailbox and custom domain connections, as well as any channel integrations you might have (Facebook Messenger, Instagram, WhatsApp). Not only can you monitor the statuses, but you also get the option to connect the available integrations or fix possible issues.
Current usage
Here you can see your current project quotas:
- Customer service (how many live conversations you've handled)
- Lyro AI agent (how many conversations Lyro has handled)
- Flows (how many unique visitors your flows have served)
Each line shows how much of the quota you've used so far, with a progress bar.
News Feed
Lastly, located at the very bottom of the Dashboard, you can see the News Feed - it shows you the latest news regarding Tidio releases, special deals, or articles (and blog posts) worth checking out.