Learn how your flows perform thanks to our actionable metrics in the Flows panel. You can see how to edit the flows based on the metrics to meet your business goals and satisfy your website visitors.
In this article, you'll learn:
- How to find flow metrics
- What the Executed metric is
- What the Engagement metric is
- What the Helpfulness metric is
- How to find conversations that started through the flow
- What the Handoff metric is
Flow Metrics
You can access your flows' metrics in the My Flows section. You'll see a quick summary of the metrics for the last 30 days: Executed, Engagement and Leads acquired at the top (Shopify stores also see Coupons used/sent and Sales assisted, which fill in once you have a Flow that sends coupon codes), and the Executed and Engagement of each Flow in the list.

To select a different date range and see more information, click on the Flow's name, or on the chart icon (View statistics) on the right of the Flow. You'll find View statistics in the three-dots menu as well.
The statistics window will open, with the Flow's name and triggers at the top, the Analyze nodes and Edit nodes buttons on the right, and these tabs: Executed, Helpfulness, Conversations and, for support Flows, Handoff:
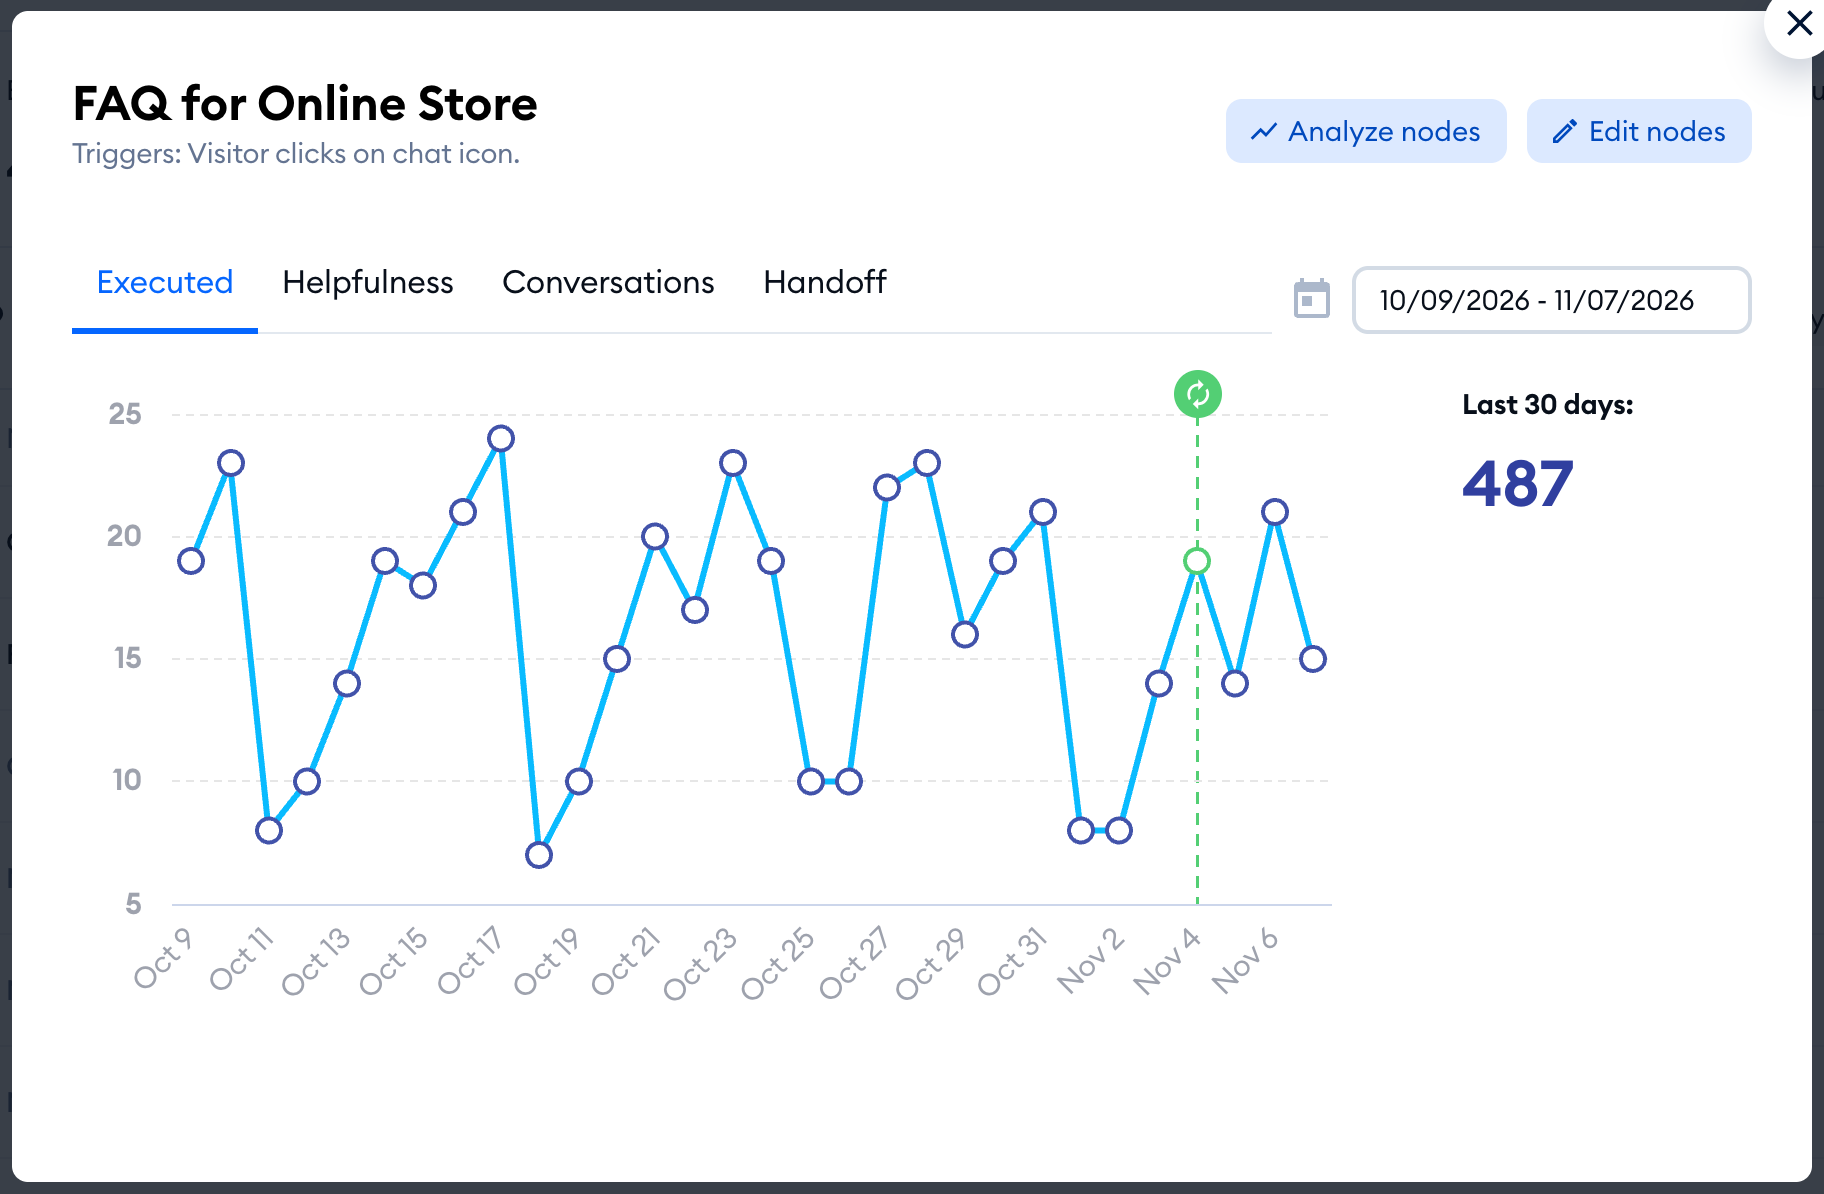
Altogether, Flows have four metrics: Executed, Engagement, Helpfulness and Handoff. We will explain all of them further in this article.
Executed
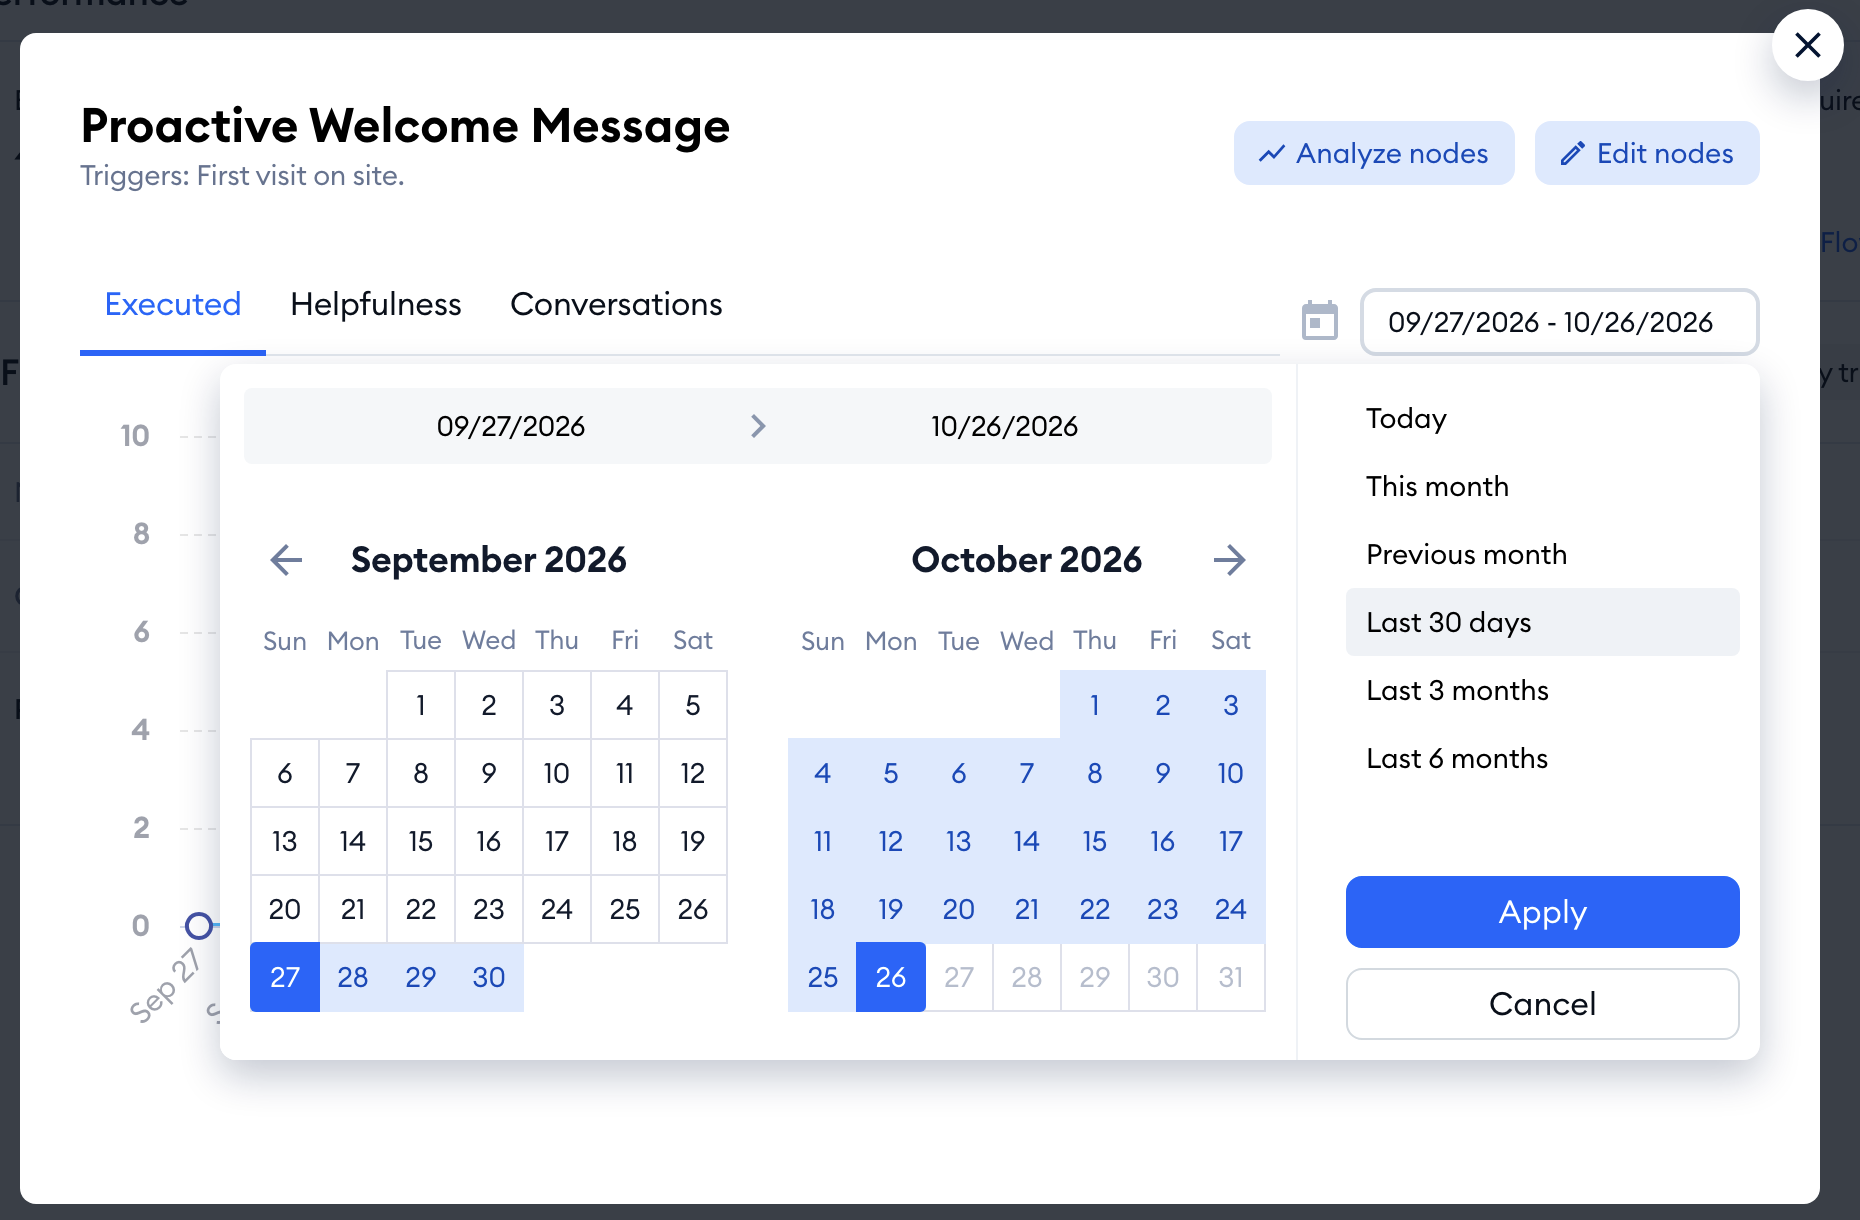
The Executed metric shows you how many times the flow has been executed. That means - how many times the visitors have seen your flow. In the statistics window, the Executed tab shows a chart for the Last 30 days by default. Use the date range above the chart to pick Today, This month, Previous month, Last 3 months, Last 6 months or your own dates, up to a year back.
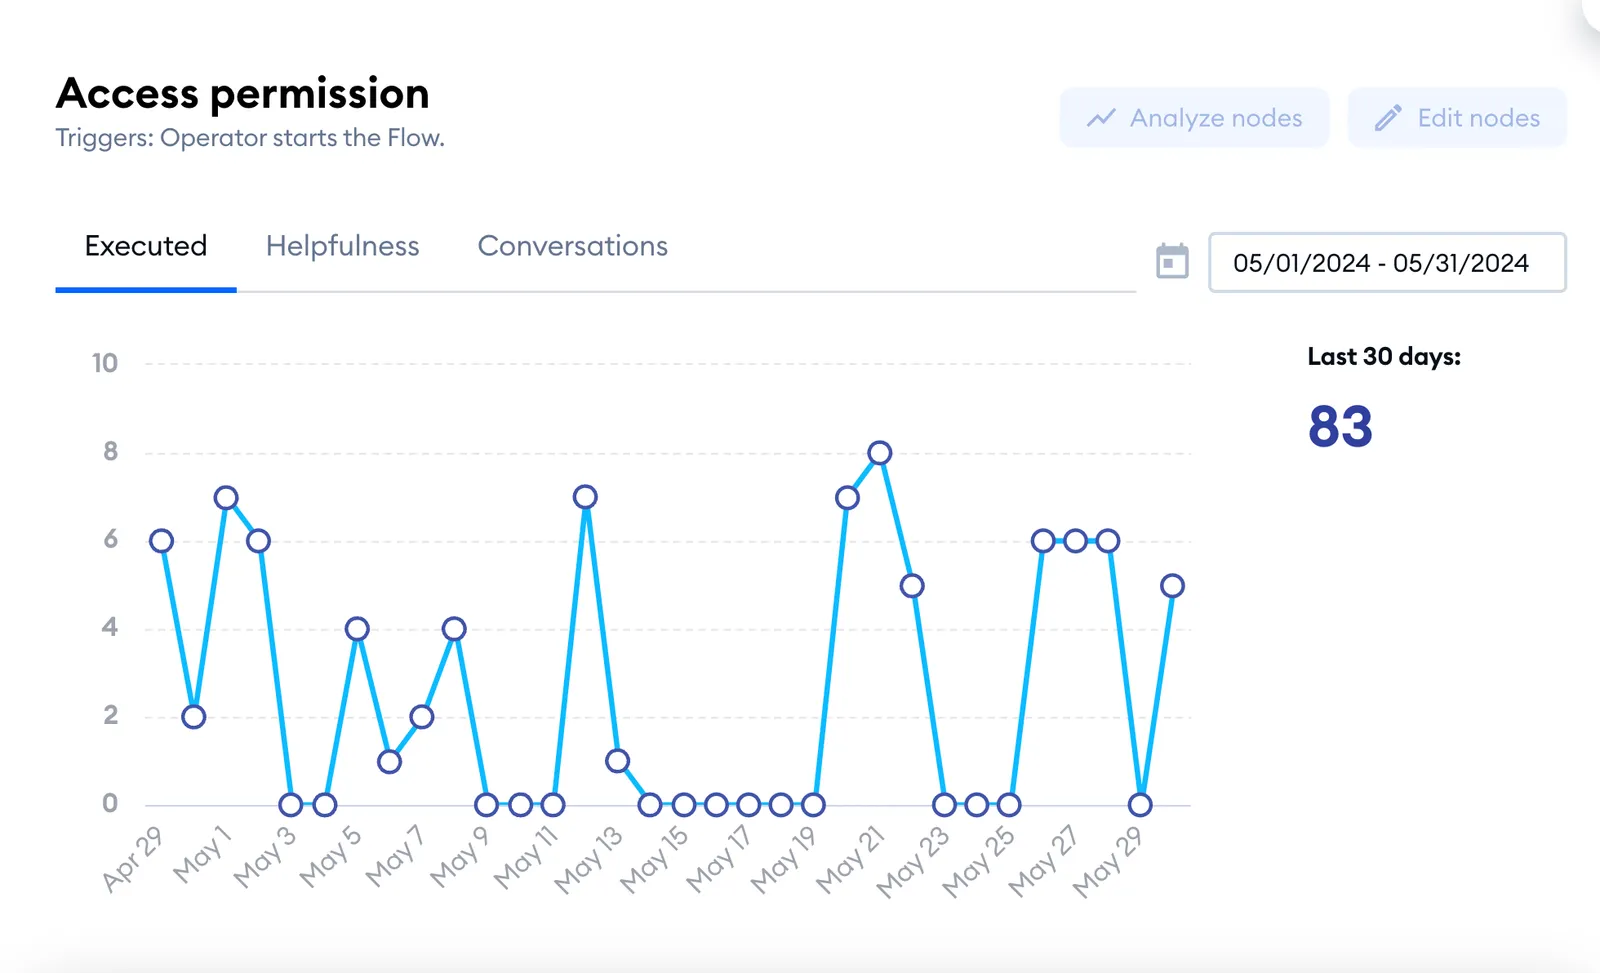
This information shows you how popular the flow is on your website. You can compare it with your website's unique page views and see what percentage of people see the Tidio flow installed on your website.
Engagement
The Engagement metric shows the percentage of visitors who interacted with the Flow (for example, clicked a button or answered a question) in the last 30 days. Hover over the value in the list to see the number of visitors behind it - and, after you've edited the Flow, how it compares with the period before your change (vs before change).
Flows that don't ask the visitor to do anything show an icon instead of a percentage, with the tooltip This Flow does not require visitor’s action.
Helpfulness
The Helpfulness metric gives your visitors a chance to leave their feedback on specific messages from the flow using a simple thumbs-up or down.
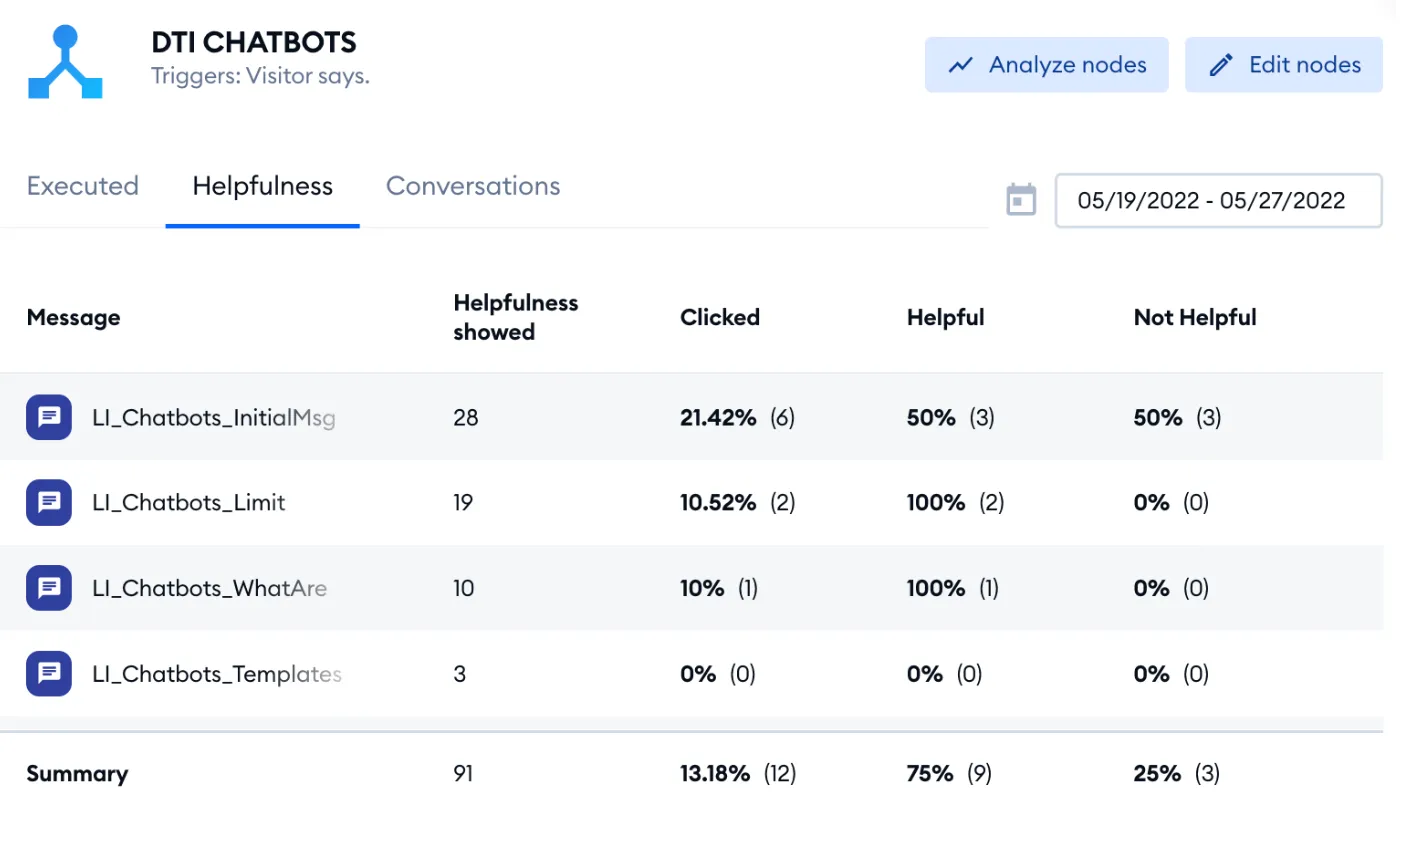
To ask for this feedback, open a message in the Flow editor and switch on Ask a visitor for feedback (Learn if this message was helpful). The Helpfulness tab of the statistics window then lists each such Message with the number of times the question was shown (Helpfulness showed), Clicked, Helpful and Not Helpful.
This can help you identify the underperforming flow replies that you can use to improve the content in flow replies for specific intents, topics, or questions. It could simply be improving the reply copy, adding images and graphics for more detailed guidance, or linking to a dedicated page on that topic.
You can learn more by heading to our article about the Helpfulness metric.
Conversations
The Conversations section shows you a list of all the conversations that started during the flow's interaction with the visitors. You'll see all the conversations that required visitors' actions, such as leaving an email address, choosing the answer from the decisions, etc.
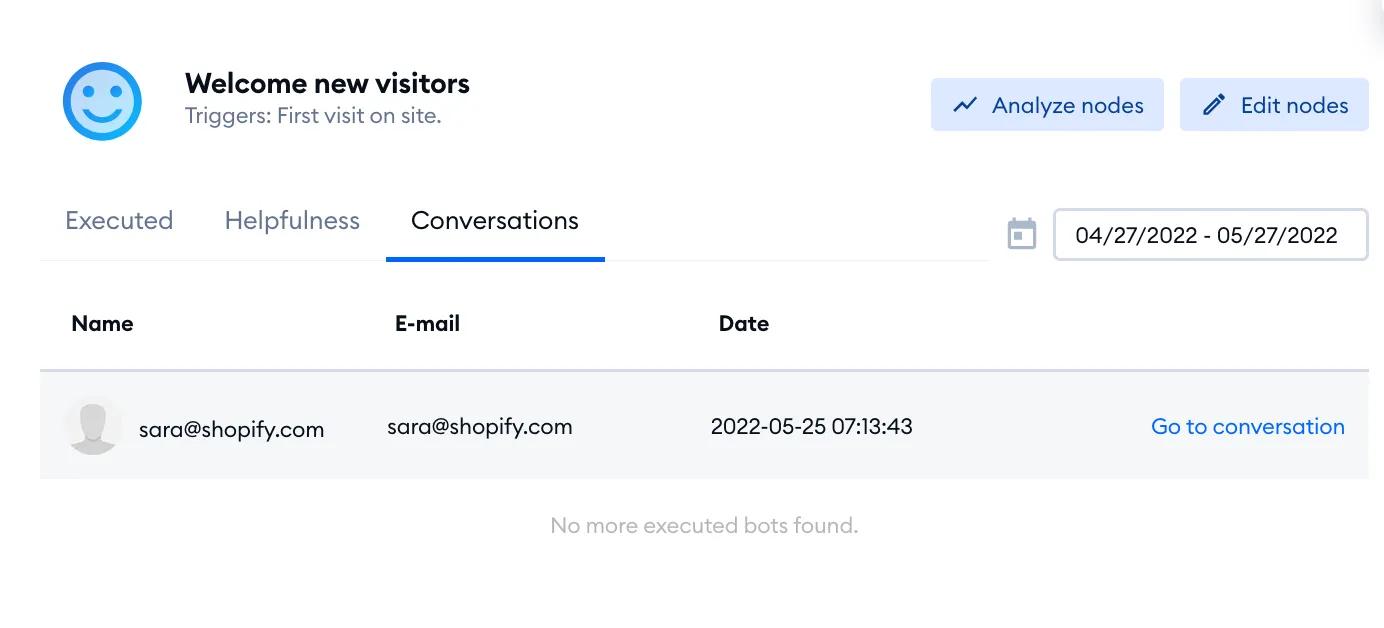
By clicking on the Go to conversation button, you'll be transferred to the specific chat in the conversation section in your Tidio panel.
Handoff
The Handoff metric shows how often visitors left the Flow by typing a message instead of using its buttons or quick replies. It's available for support Flows (saved with the I want to solve problems goal), in the Handoff tab of the statistics window and in the Flow editor's Analyze mode. Learn more in The Handoff Metric.