The helpfulness metric in Tidio allows customers to provide feedback on flow messages using a simple thumbs-up or thumbs-down option. By collecting this feedback, you can identify underperforming flow replies and make improvements to enhance the customer experience.
In this article, you'll learn:
- What is the helpfulness metric
- How helpfulness metric works at Tidio
- How to read the Helpfulness tab
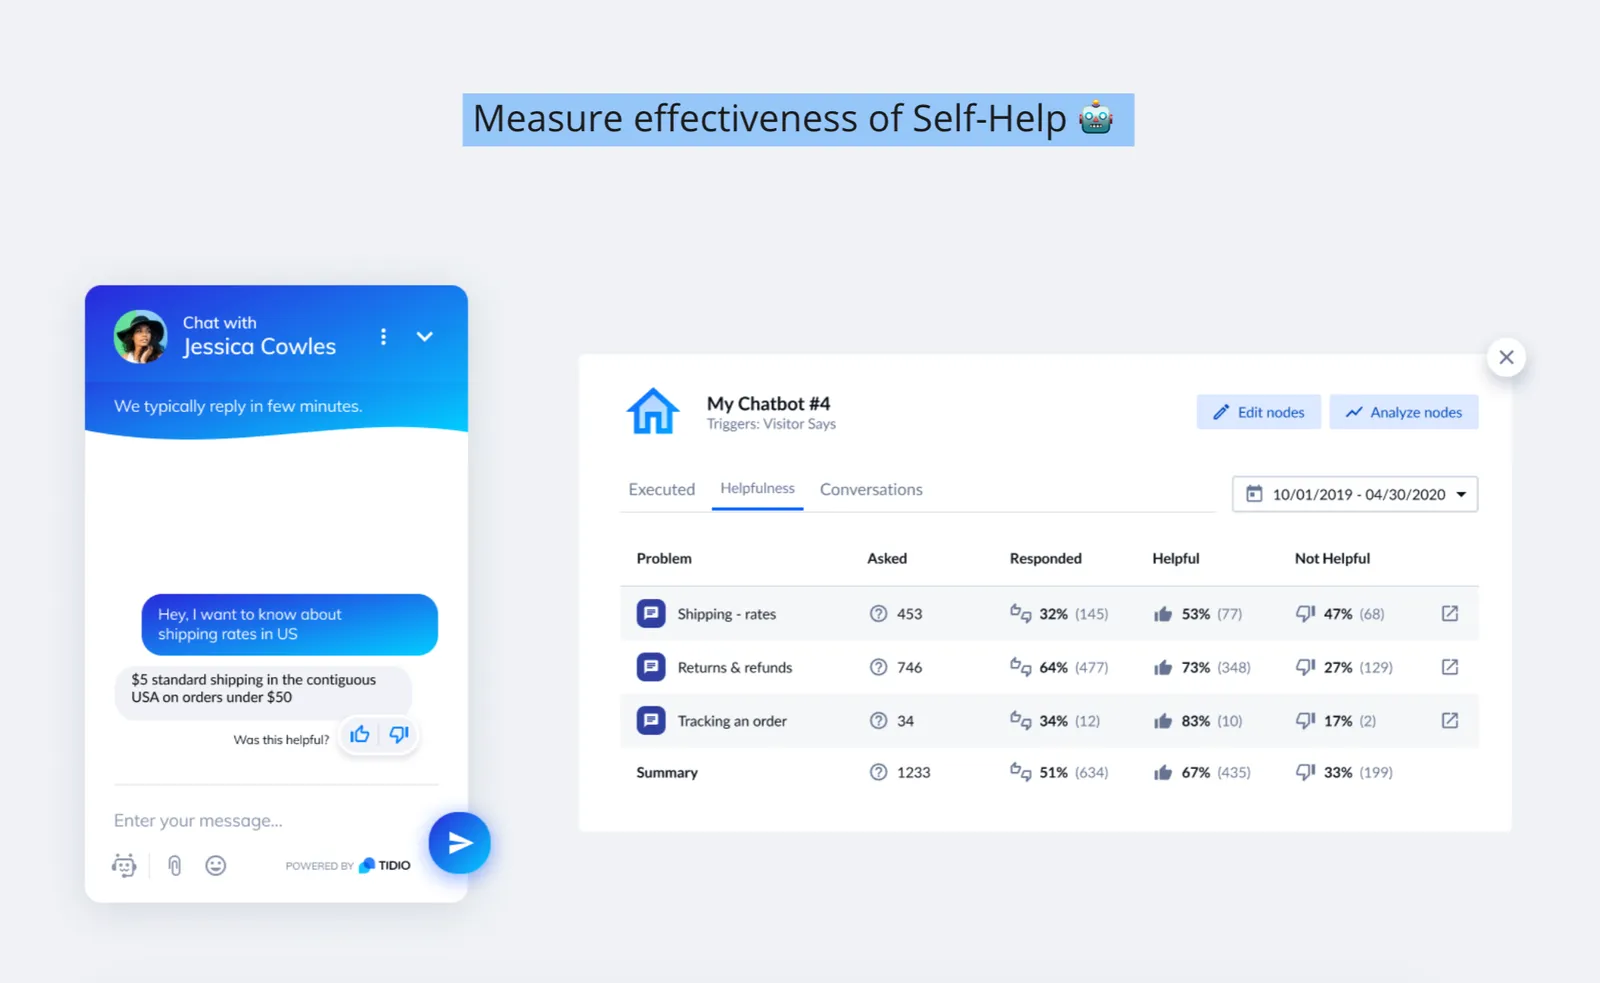
Helpfulness Metric
The helpfulness metric can help you identify the underperforming flow replies that you can use to improve the content in flow replies for specific intents, topics, or questions.
It could simply be improving the reply copy, adding images and graphics for more detailed guidance, or linking to a dedicated page on that topic.
Helpfulness is one of the four flow metrics, next to Executed, Engagement and Handoff - see Flow Metrics for all of them.
How does helpfulness metric work?
You can enable the Helpfulness metric in the flow editor: click on a Send a chat message node, and switch on Ask a visitor for feedback (Learn if this message was helpful) below the message. The toggle is available on the Send a chat message node only. You can also change the node's name at the top of the panel, since it will be displayed in Helpfulness statistics - if you don't, the node is named Send a chat message when you switch the toggle on.
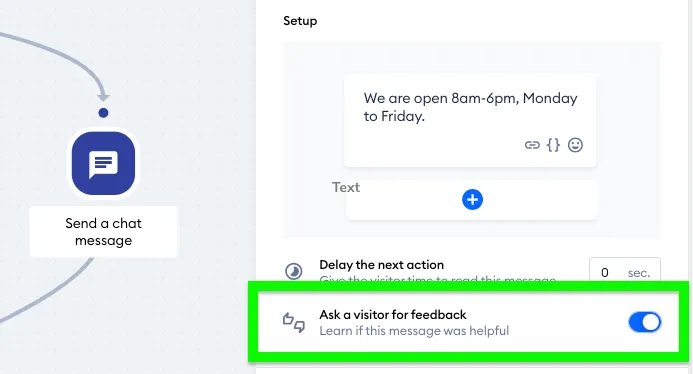
Each time the message is sent to the Visitors, they can like or dislike it. That will suggest if the message was helpful or not.

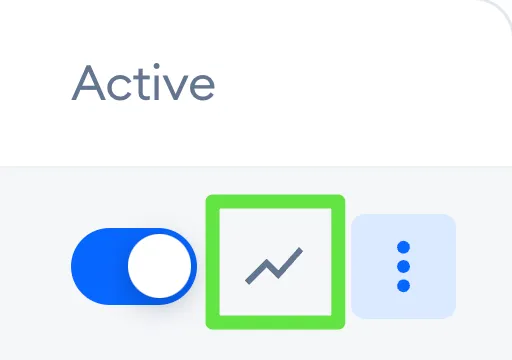
Statistics are available in the flow's statistics window, which you can open from the My Flows list in a few ways: by clicking on the flow's name, on the three-dots menu > View statistics, or simply on the chart icon (View statistics) next to the Active toggle:
Reading the Helpfulness tab
On the flow's statistics screen, you can access the Helpfulness tab - and see all the available details in columns:
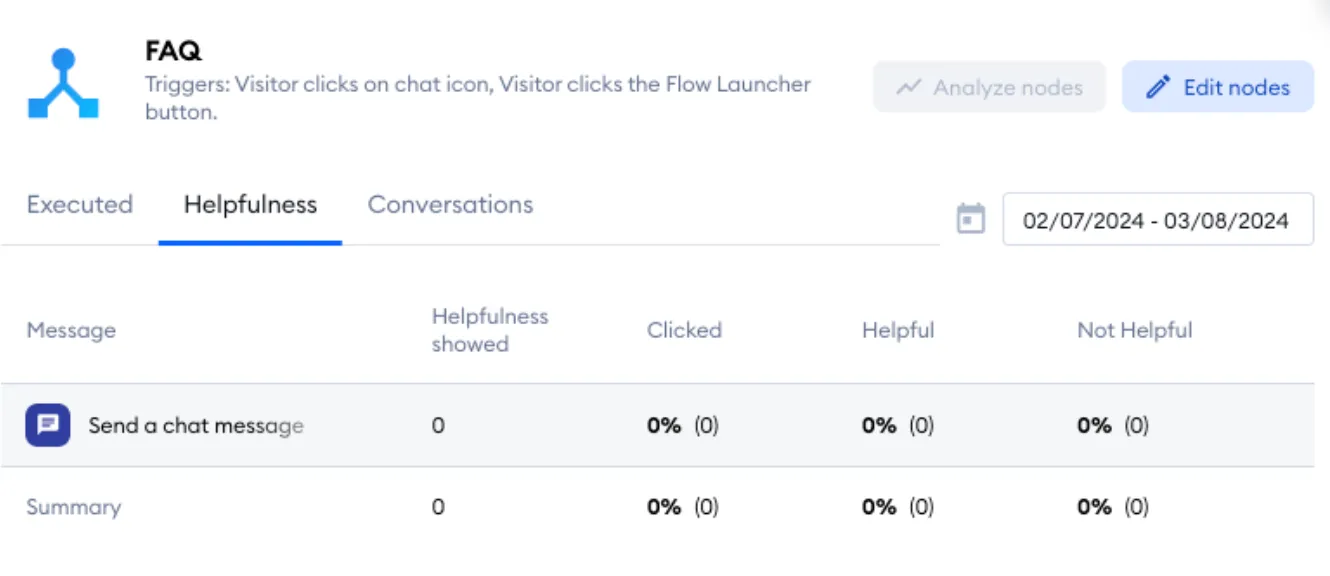
- Message - the name of each message that asks for feedback.
- Helpfulness showed - how many times visitors were asked whether the message was helpful.
- Clicked - the share (and number) of those times a visitor clicked a thumb.
- Helpful and Not Helpful - the share (and number) of thumbs up and thumbs down.
The Summary row at the bottom adds up all the messages of the flow.
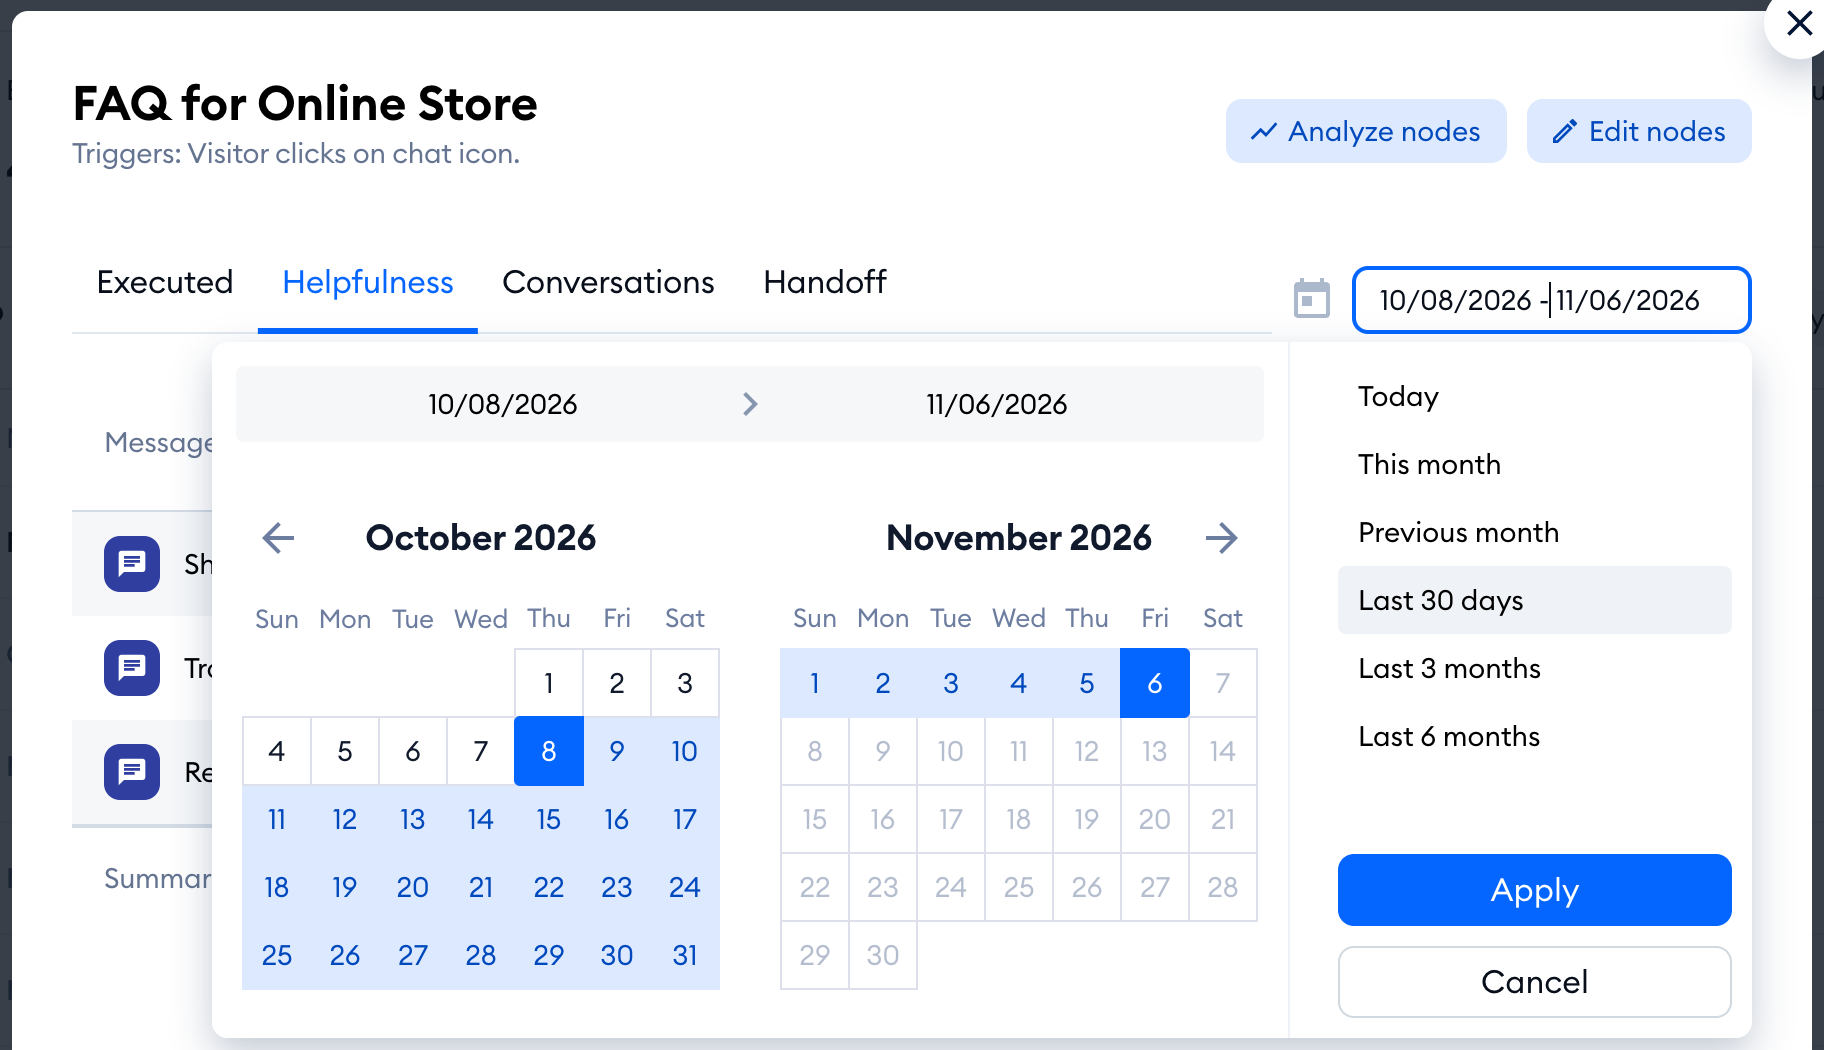
By default, you'll see the Last 30 days. Use the date range above the table to pick Today, This month, Previous month, Last 3 months, Last 6 months or your own dates, up to a year back:
Please note: if none of the flow's messages asks for feedback, the tab shows There is no node asking for helpfulness instead of the table.
To learn more, see other ways to measure flow performance.