Flow analytics allow you to track, in detail, how your visitors interact with each element of the flow. It's a great analytic extension to our standard flow performance analytics. With these metrics, you'll start making data-driven decisions to enhance your website and flow experience.
Learn how your flows perform
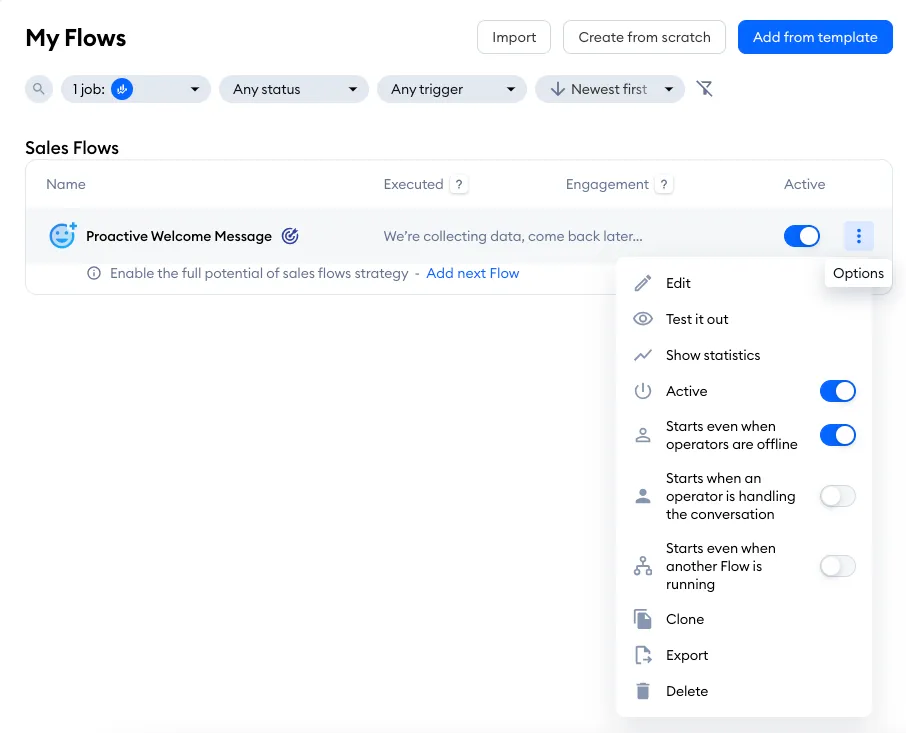
To learn how your flows perform in detail, navigate to your Flows panel. Find a flow you would like to take a closer look at and click on the three dots menu next to it. Select the Edit option.
You'll now enter the visual flow editor, where at the bottom left corner of the panel, you can choose between two modes:
- Edit → here you can build and customize your flows;
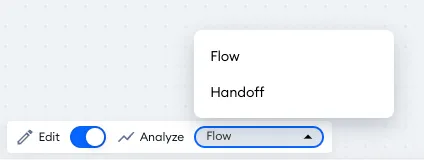
- Analyze → here you can see the statistics (Flow, Handoff).
You can also go straight to Analyze mode from the flow's statistics window: click on the flow's name in My Flows (or on View statistics), and hit Analyze nodes.
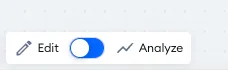
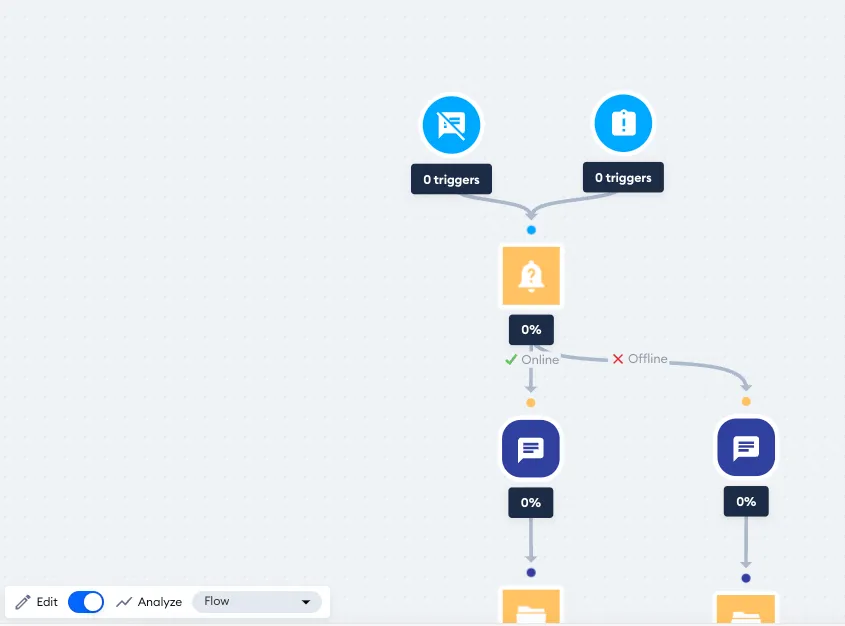
With the Analyze mode, you can learn what nodes are executed most (the Flow option), or see points in the flow where the visitor abandoned the interaction (the Handoff option). Simply switch the toggle from Edit to Analyze, and select which statistics you'd like to see in the list next to it - the list (and the Handoff option) is there for support flows only:
Flow analysis
With the Flow option, you can see the number of times each trigger started the flow, and the amount of visitors who have reached each step of the flow (in percentages). Hover over a step's percentage to see, for example, "120 of 400 unique visits" in the selected dates:
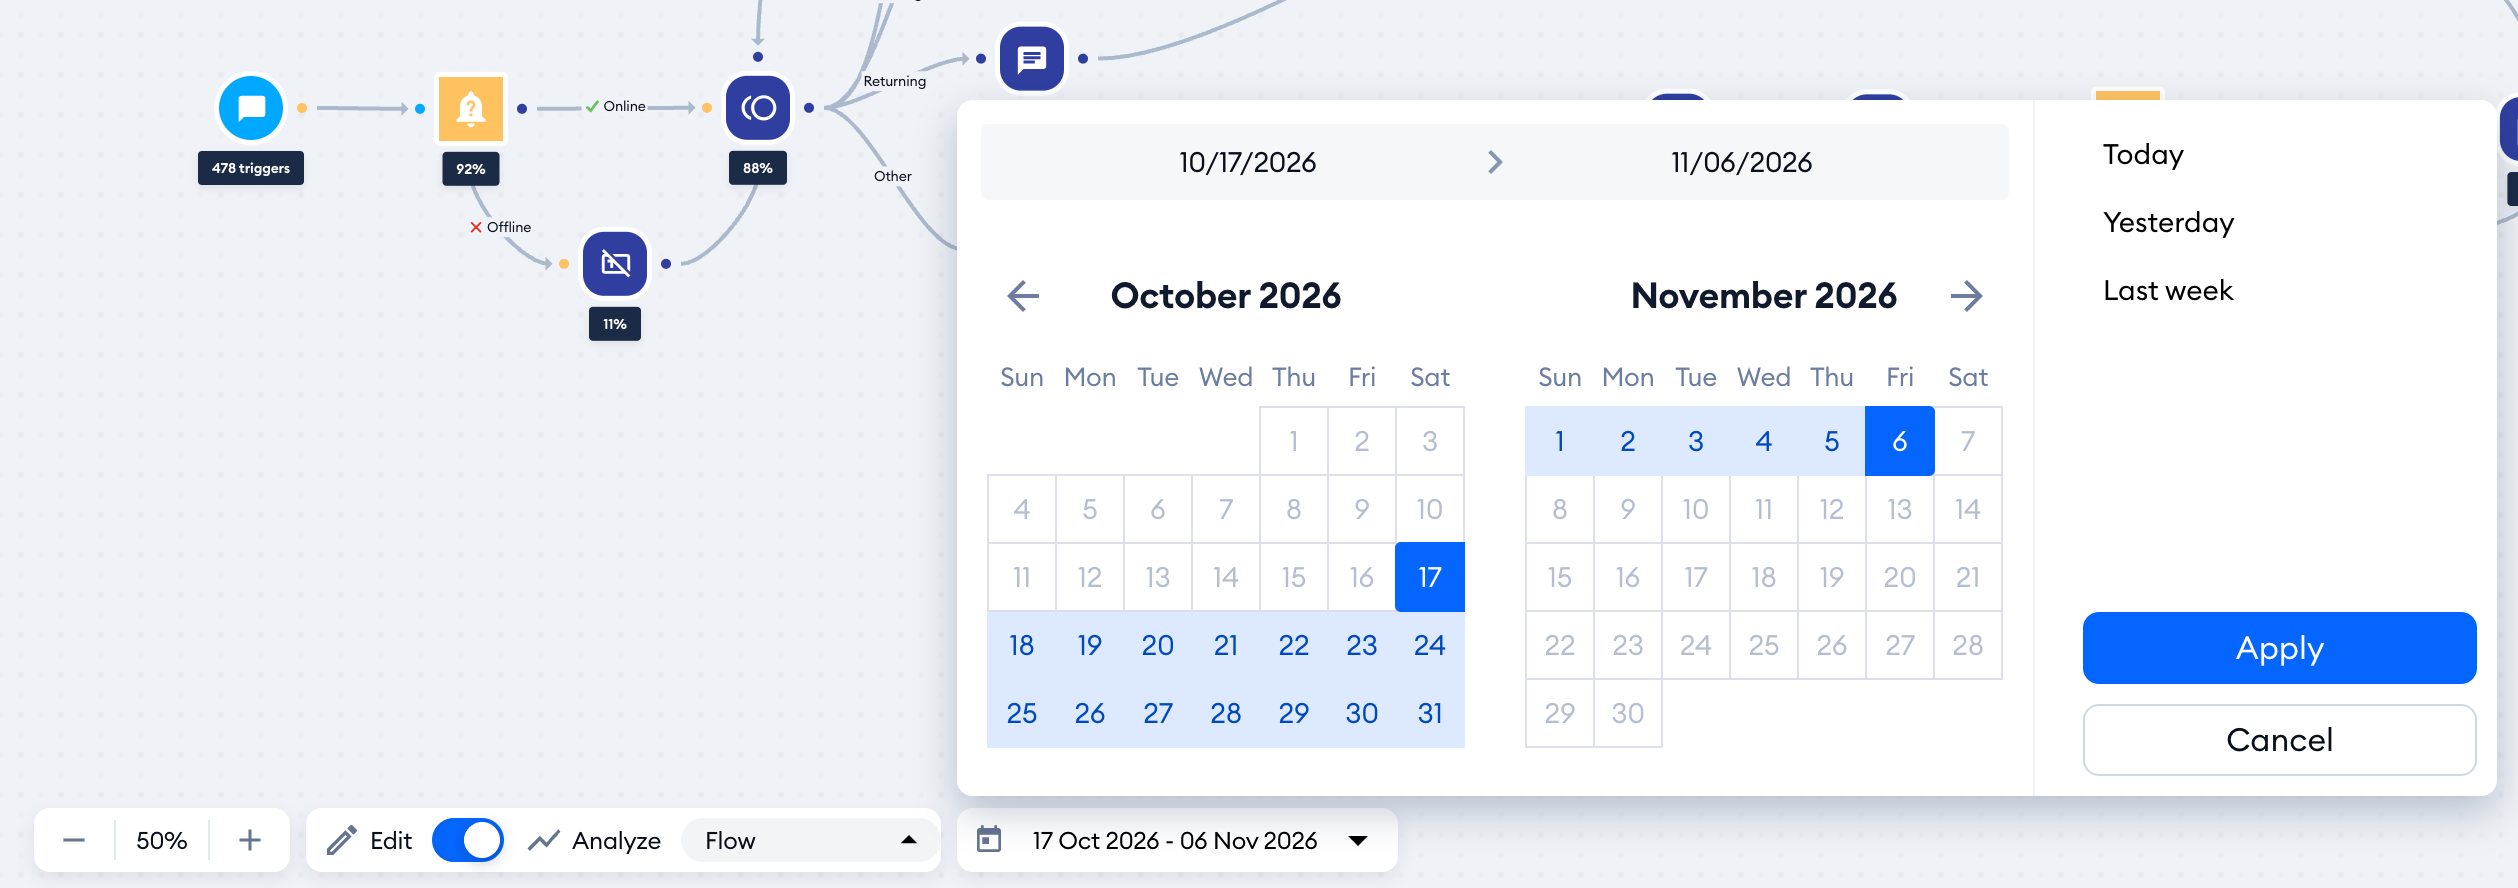
Please note: Analyze mode shows the Last 30 days by default. Use the date range next to the switch to pick Today, Yesterday, Last week, Last 30 days, Last 90 days or your own dates, up to 90 days back. Step statistics start again each time you change the flow, so you can't pick dates from before your last change.
Handoff analysis
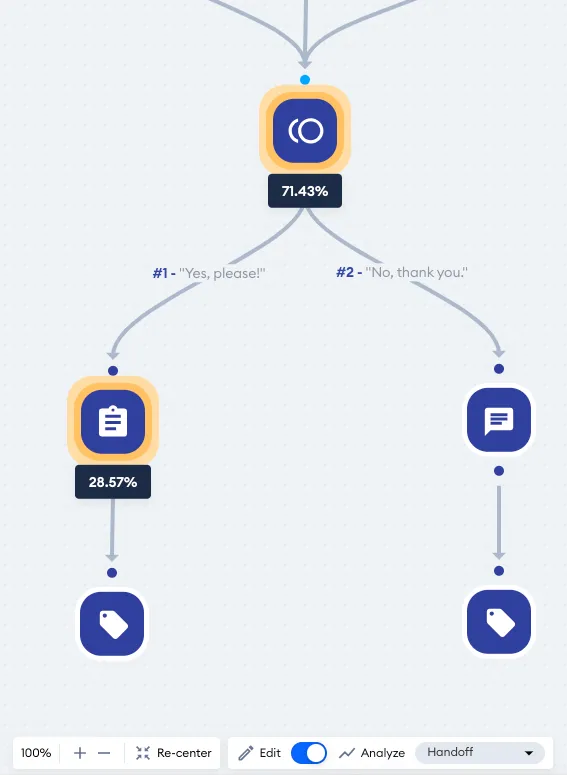
When using the Handoff option, you can see the points in your flow where visitors abandoned the interaction (e.g. sent a chat message instead of using the flow further). This way you can identify moments that may need improvement.
Similarly to Flow analysis, the numbers are shown in percentages:
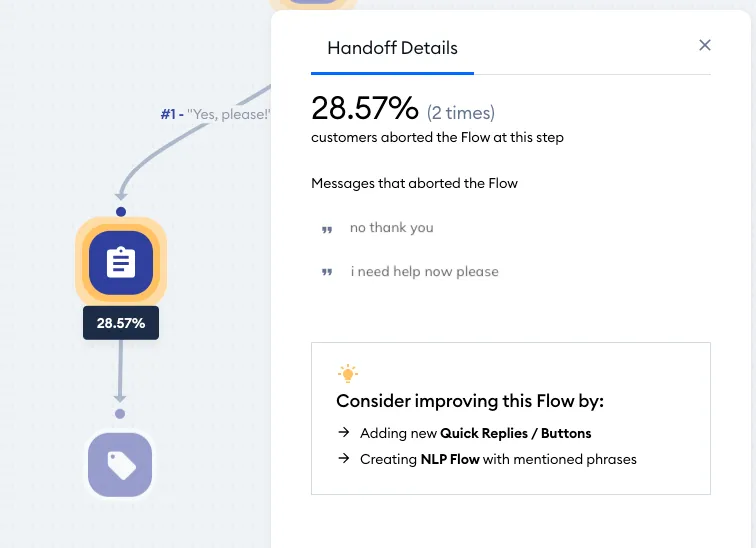
When you click on a specific node where handoff took place, the Handoff Details panel opens with some more details, and even advice (Consider improving this Flow by:). What you may find useful are the actual chat messages that caused the flow to be abandoned, under Messages that aborted the Flow:
For a quick reference, you'll also find the Handoff metric in the flow's statistics window: click on the flow's name in the My Flows list, and open the Handoff tab. Handoff isn't a column in the list - the list shows Executed and Engagement only.
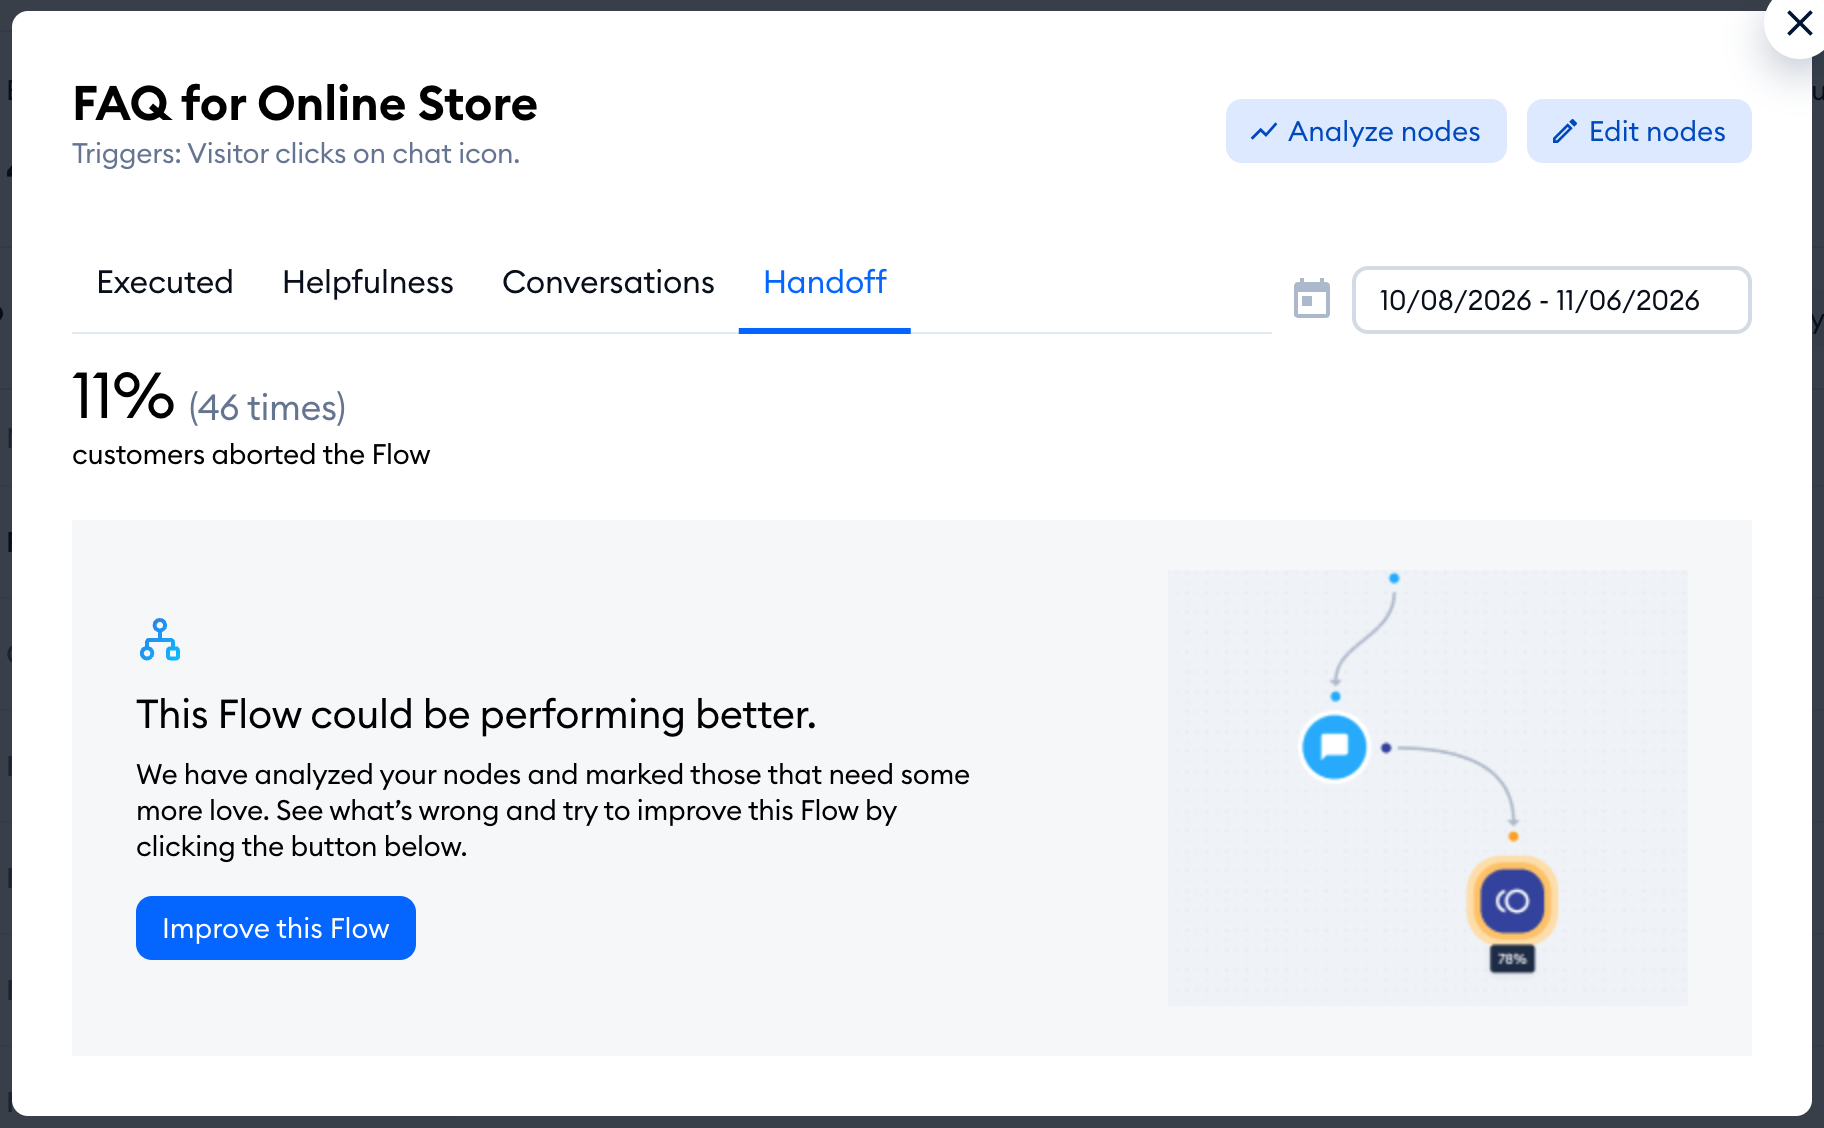
Please note that not all flows will include the Handoff metric: it's available for support flows only - the flows saved with the I want to solve problems goal. For other flows, the Handoff tab and option will simply not be available to check.
To learn more, see our article about the handoff metric.