Since Tidio is a live chat application (a tool for interactive messaging), it needs to be loaded from a JavaScript file. Some performance testing tools may start reporting that the app slows down the page load times because of the resources it needs. Let’s check what the causes of that might be.
In this article, you'll learn:
- How to load the chat asynchronously
- Tidio Loading Speed - Results
- Why do you see an error about loading an external JavaScript file
- How to check the loading speed of the widget
Loading the chat asynchronously
The installation code provided by Tidio includes the async attribute. Your browser can download the widget script while it continues parsing your page. The widget still uses network and browser resources, so measure its effect on your own website.
You will find your unique javascript code with the async attribute.
The async attribute does not guarantee that other scripts or website errors cannot affect the widget. If it is slow or does not appear, check its requests and any errors in your browser developer tools.
Tidio Loading Speed - Results
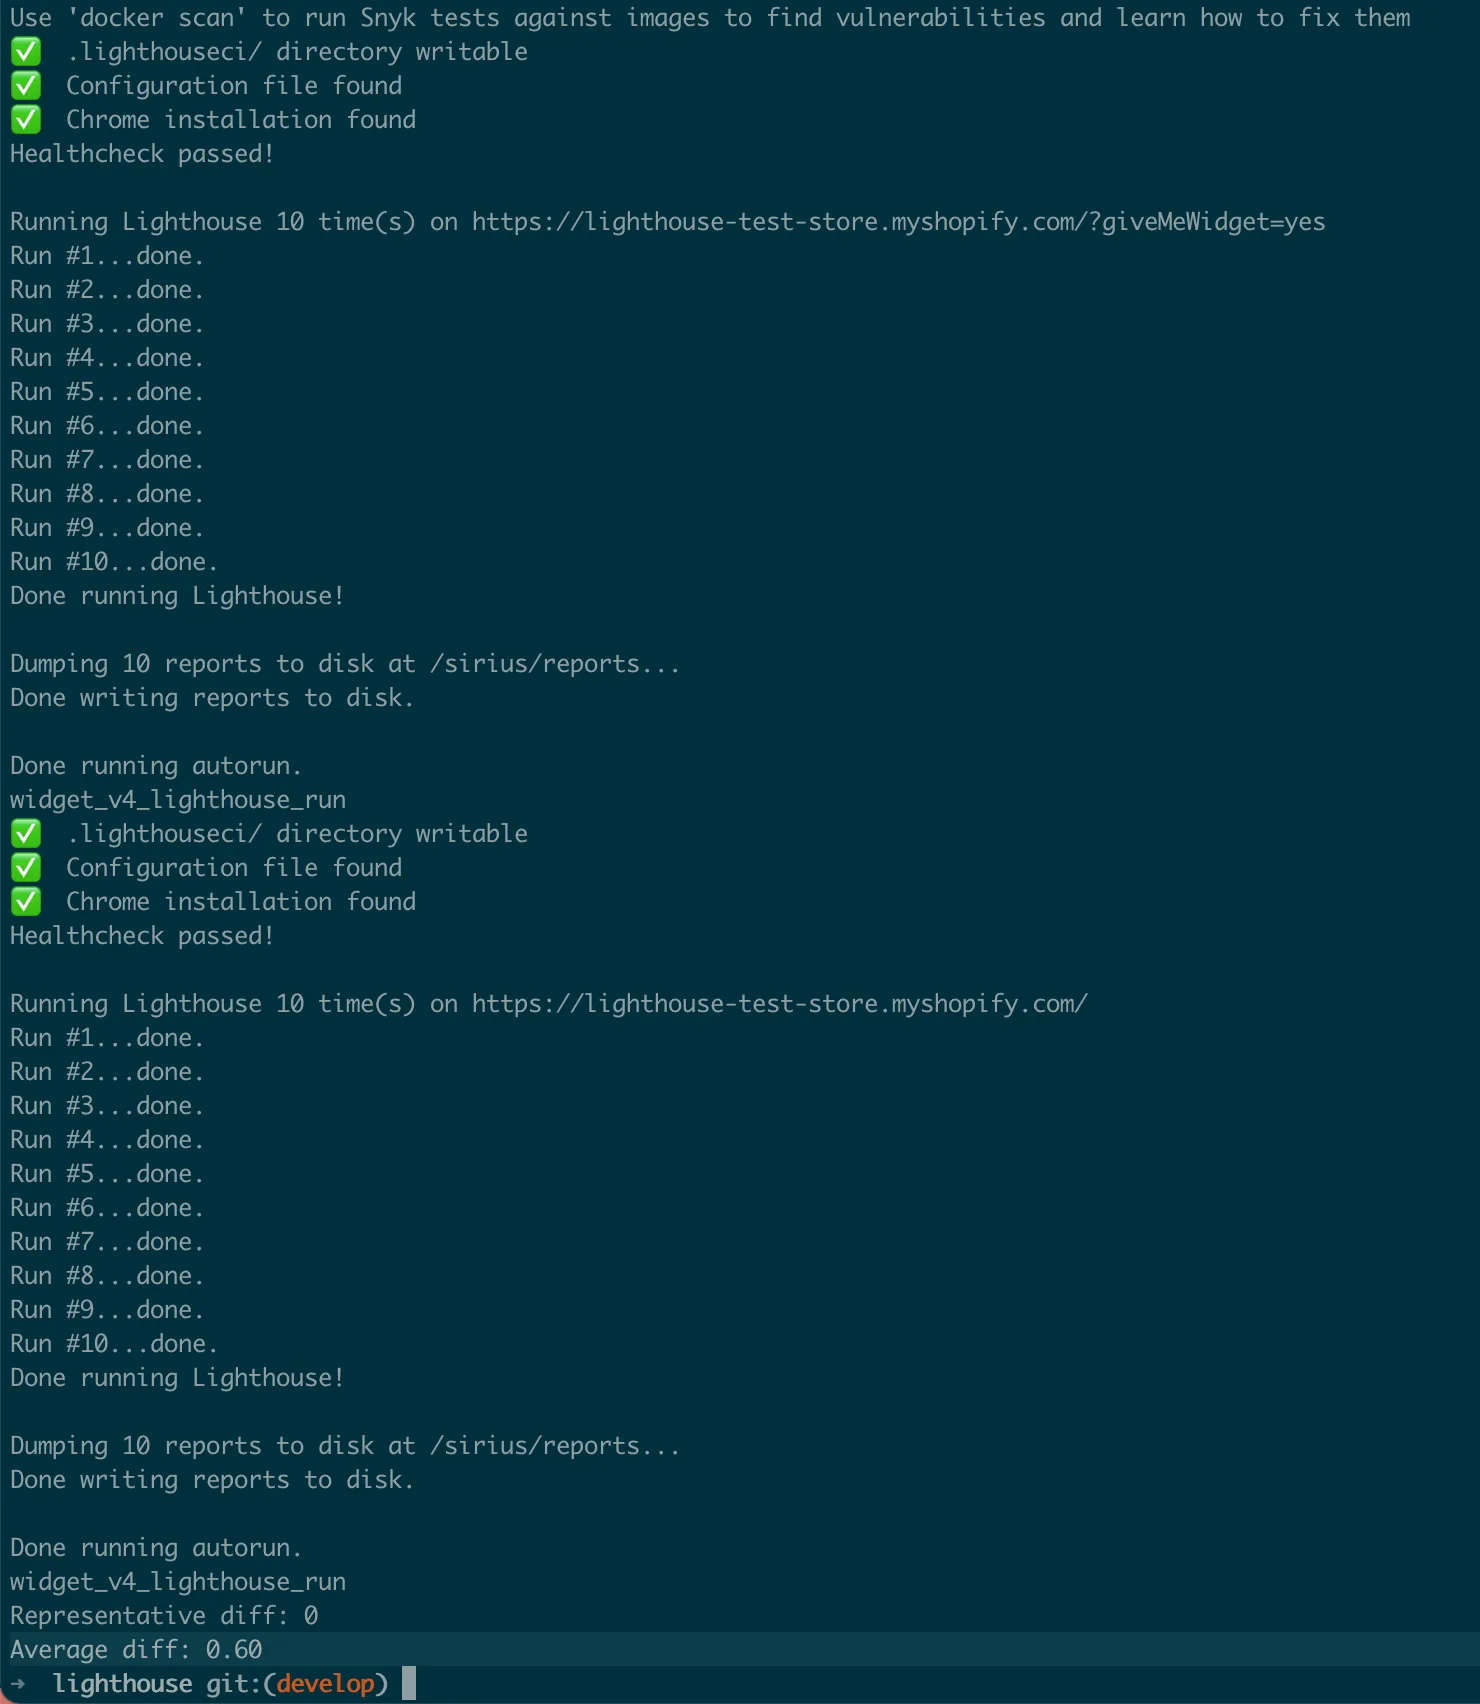
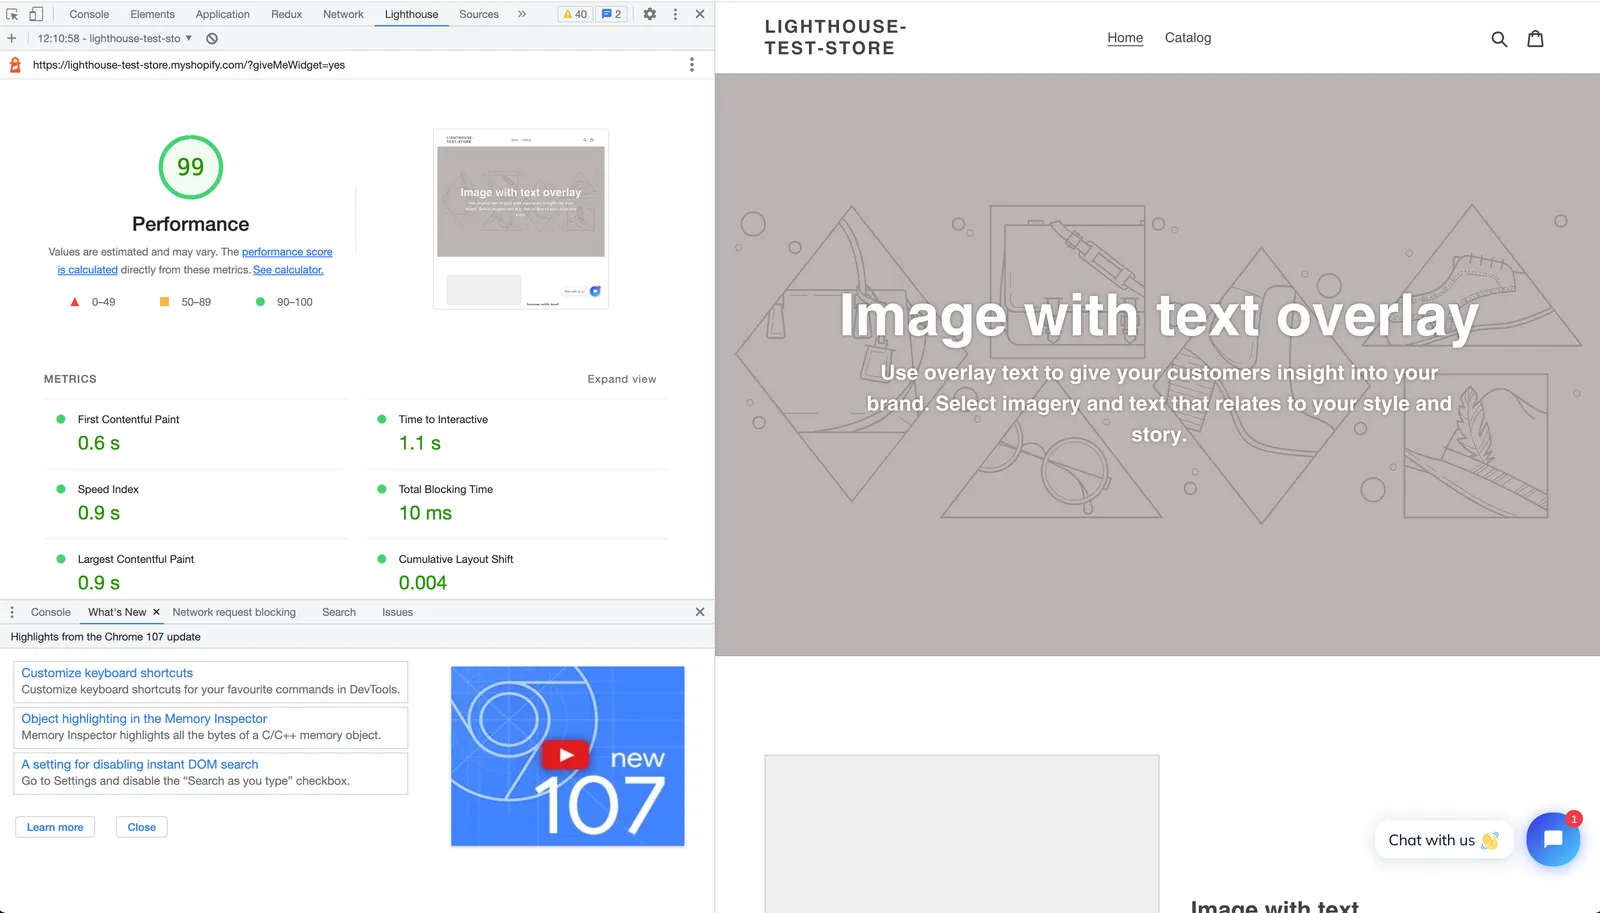
We used LightHouse CLI to make 10 test cases with and without our widget on a clean Shopify store and calculate the difference in performance score. You can see the results of that earlier test below. These are examples, not a guarantee of the score for your website:
Error about loading an external JavaScript file
Tidio's installation script loads from code.tidio.co, rather than your website's server. External resources can add network and browser work. Check the specific warning in your performance report instead of assuming that an external script is harmless or that the warning means the script failed to load.
Leveraging cache time
Browser caching can reduce repeat downloads of scripts as well as images. How long a resource can be reused depends on its HTTP cache headers. Inspect the resource's response headers before changing your site's caching settings; your site's settings do not control the cache headers sent by Tidio's servers.
Checking the times yourself
Use Lighthouse to investigate overall page performance and your browser's developer tools to inspect individual requests. In Chrome, right-click the page and select Inspect to open DevTools.
Select the Network tab and reload the page to record its requests. The Time column shows how long each request took. Sort by that column to find slow requests.
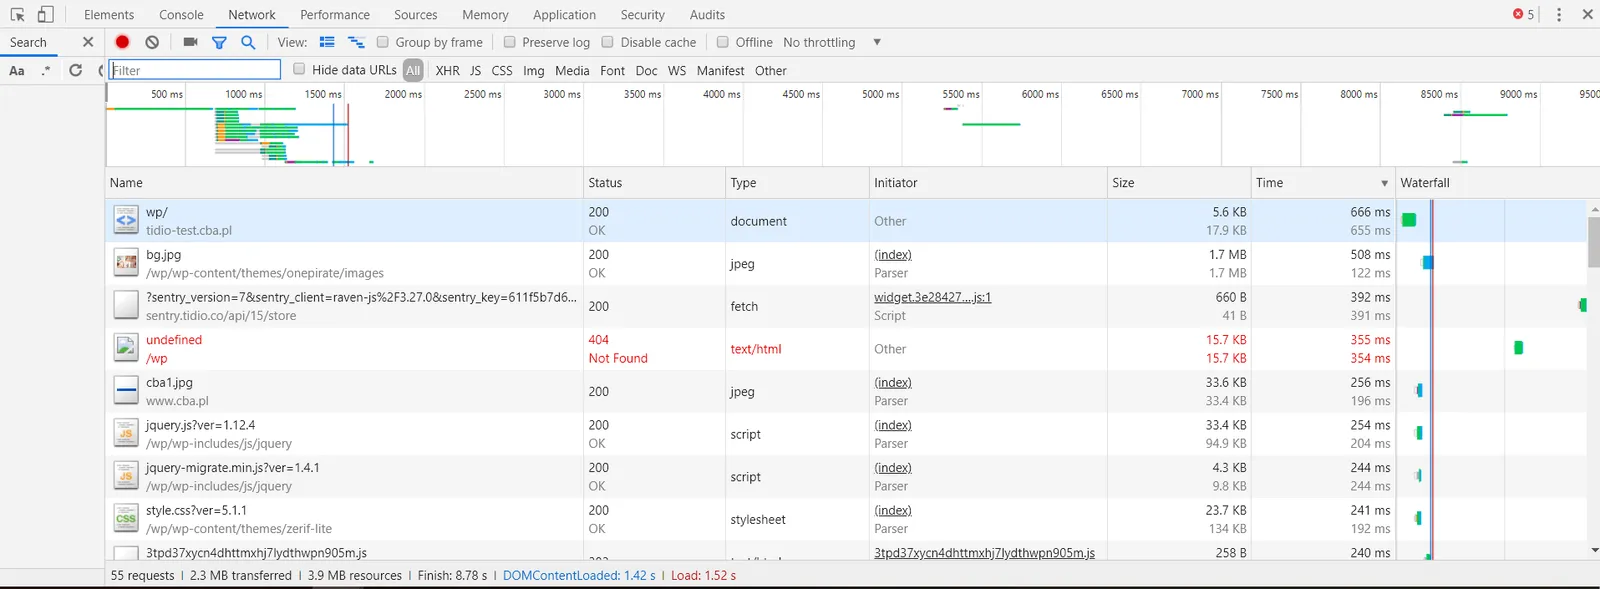
Look for the Tidio script in the request list. Its request time measures the download, not the complete time needed to initialize the widget or its effect on page responsiveness.